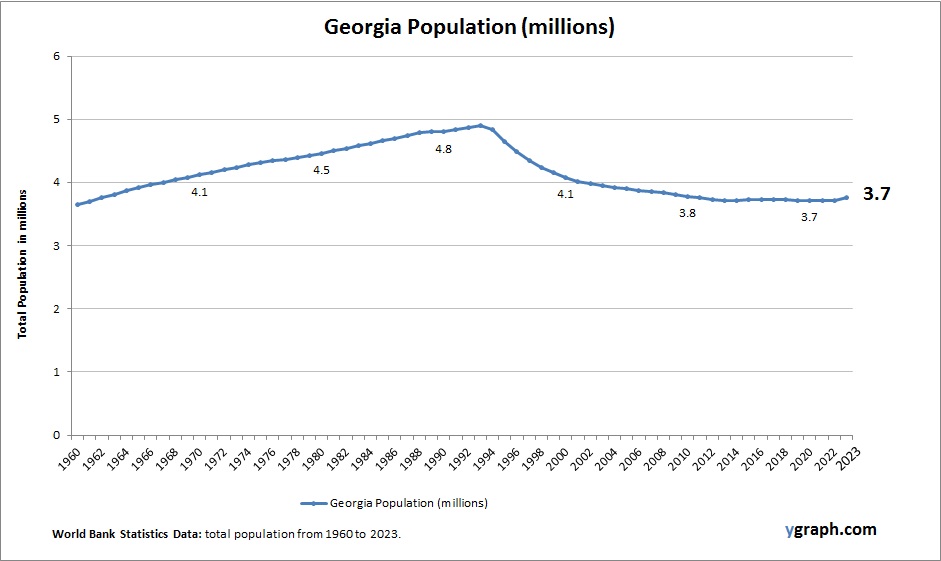
World Population Projections are estimates of the future size, growth, and distribution of the human population based on current and historical data. They are produced by various organizations, such as the United Nations (UN), the World Bank, and the U.S. Census Bureau, using different methods and assumptions.
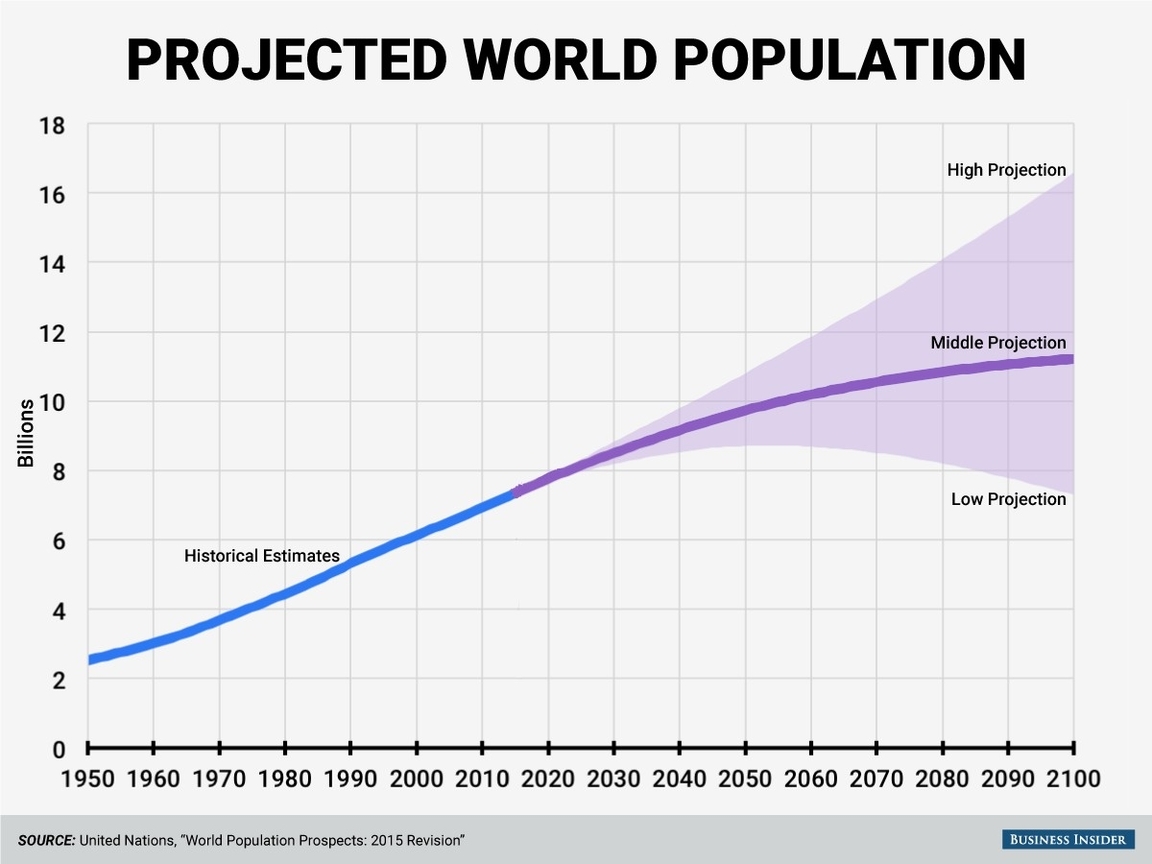
The UN publishes its World Population Prospects every few years, which is the most widely used and cited source of global population projections. The latest edition, the 2022 revision, presents population estimates from 1950 to the present and projections to the year 2100 for 237 countries or areas. The UN uses a probabilistic approach that incorporates uncertainty and variability in the projections, and provides different scenarios based on different assumptions about fertility, mortality, and migration.
According to the UN’s medium-variant projection, the world population is expected to reach 8 billion in 2022, 8.5 billion in 2030, 9.7 billion in 2050, and 10.4 billion in 2100. The world population growth rate is projected to decline from 1.1% per year in 2020-2025 to 0.1% per year in 2095-2100. The global average life expectancy at birth is projected to increase from 72.6 years in 2020-2025 to 77.1 years in 2095-2100. The global total fertility rate is projected to decrease from 2.5 children per woman in 2020-2025 to 1.9 children per woman in 2095-2100.
The UN also provides projections for different regions and groups of countries, such as the UN development groups, the World Bank income groups, the geographic regions, and the Sustainable Development Goals (SDGs) regions. The projections show that the population growth will be unevenly distributed across the world, with some regions experiencing rapid growth and others facing