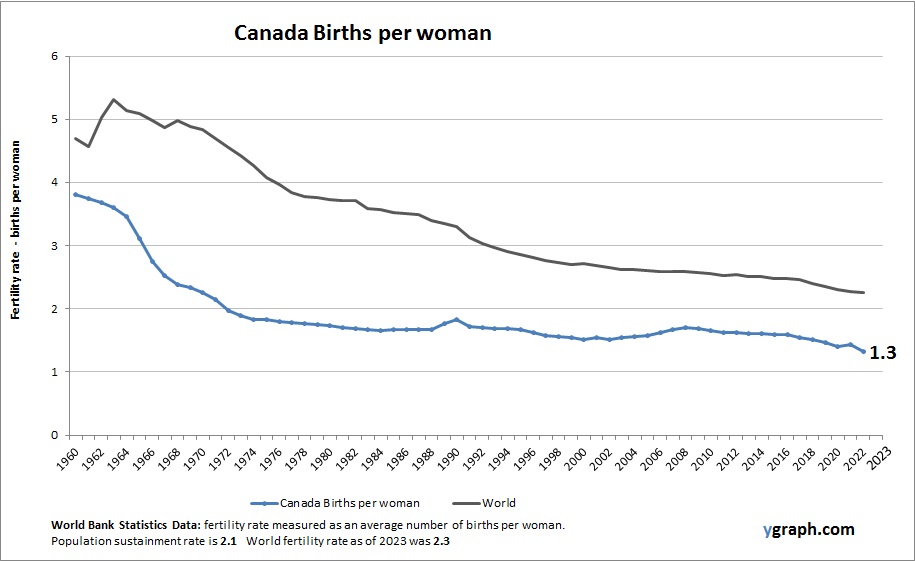
British Virgin Islands Births per woman

The above graph shows British Virgin Islands Births per woman. The fertility rate statistics are compiled by World Bank. Based on the latest available information for British Virgin Islands.

The British Virgin Islands has a low fertility rate, reflective of its developed healthcare system and high living standards. Smaller family sizes are common, and migration plays a significant role in shaping the territory’s demographic structure, especially as more young professionals move for work opportunities.

British Virgin Islands Births per woman

El Salvador Births per woman

Chart above demonstrates El Salvador Births per woman. World Bank is the source of this birth data. Based on the latest demographics info provided for El Salvador.

El Salvador’s fertility rate has declined due to increased education, healthcare access, and urbanization. Population growth is slowing, though rural areas tend to have higher birth rates than urban centers. Migration, particularly to the United States, affects population size and structure, shaping social and economic dynamics.

El Salvador Births per woman

Botswana Population

Chart above demonstrates Botswana Population. World Bank is the source of this population data. Based on the latest demographics info provided for Botswana.

Botswana has a growing population with a relatively young age structure, shaped by moderate fertility rates and improvements in healthcare. Urbanization is increasing, particularly in the capital Gaborone, while rural areas still retain significant population shares. Economic development and HIV/AIDS management influence demographic dynamics.

Botswana Population

Central Europe and the Baltics Births per woman

This diagram presents Central Europe and the Baltics Births per woman. World Bank is the source of this birth data. Based on the latest demographics info provided for Central Europe and the Baltics.

Fertility rates across Central Europe and the Baltics remain below replacement level, despite various family-friendly policies. Economic migration and aging are significant issues, and regional governments are working to incentivize higher birth rates.

Central Europe and the Baltics Births per woman

Croatia Births per woman

Chart above demonstrates Croatia Births per woman. This is according to World Bank birth stats by country. Based on the latest demographics info provided for Croatia.

Croatia has low fertility rates below replacement level, contributing to population decline and aging. Migration, particularly of young people to other EU countries, exacerbates demographic challenges. Urban centers maintain more stable populations, but rural areas face significant decline. Efforts are being made to encourage family growth.

Croatia Births per woman

Albania Population

This diagram presents Albania Population. World Bank is the source of this population data. Based on the latest demographics info provided for Albania.

Albania’s population is slowly declining due to low fertility rates and significant emigration, particularly among the youth. The demographic structure is aging, with many younger citizens seeking work abroad. The government is attempting to reverse this trend with incentives for returnees and support for families.

Albania Population

Cyprus Population

The above graph shows Cyprus Population. World Bank is the source of this population data. Based on the latest available information for Cyprus.

Cyprus has a stable population with low growth rates influenced by low fertility and aging demographics. Immigration plays a significant role in maintaining population levels. Urban areas dominate, with economic development concentrated in services and tourism sectors. Demographic challenges include managing aging populations and encouraging higher birth rates.

Cyprus Population

Cayman Islands Births per woman

This diagram presents Cayman Islands Births per woman. The fertility rate statistics are compiled by World Bank. Based on the latest demographics info provided for Cayman Islands.

The Cayman Islands have a low to moderate fertility rate, influenced by high standards of living, urbanization, and access to healthcare. Migration plays a significant role in population changes, with a substantial expatriate community contributing to demographic shifts.

Cayman Islands Births per woman

Central Europe and the Baltics Population

Chart above demonstrates Central Europe and the Baltics Population. World Bank is the source of this population data. Latest population information for Central Europe and the Baltics.

The population of Central Europe and the Baltics has been experiencing gradual decline and aging, largely due to low fertility rates and emigration. Countries in this region are implementing various policies to attract migrants and encourage family growth to stabilize population numbers.

Central Europe and the Baltics Population

Bolivia Population

The above graph shows Bolivia Population. The country statistics are compiled by World Bank. Based on the latest available information for Bolivia.

Bolivia’s population is steadily growing, driven by relatively high fertility rates and a youthful demographic. While urbanization and improved access to education are changing family dynamics, traditional rural areas still maintain larger family sizes, contributing to ongoing growth.

Bolivia Population