USA GDP PPP

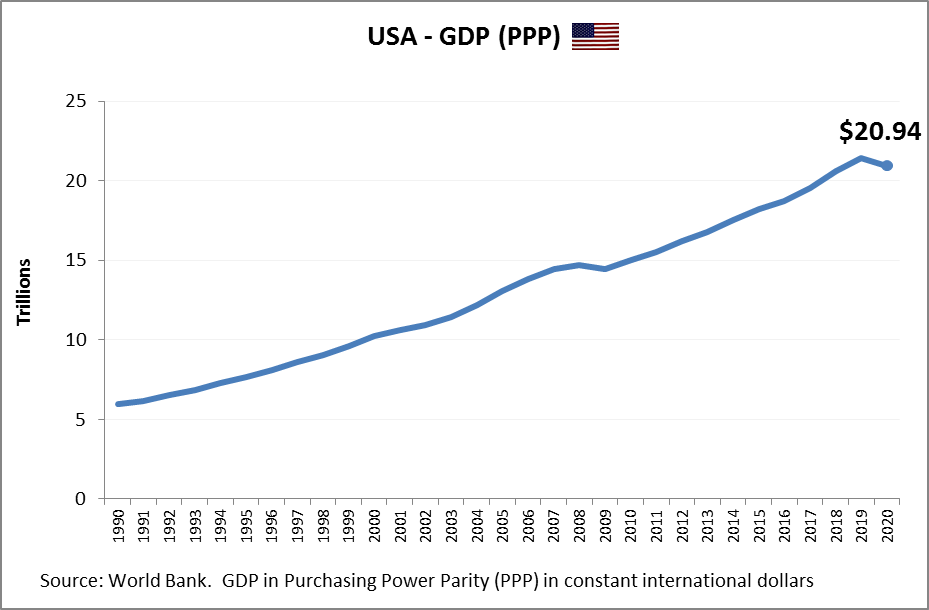
USA economy size measured in Power Purchasing Parity, i.e. comparing relative standard of living and ability to afford goods and services. USA’s Gross Domestic Product (GDP) chart showing historical economic growth as measured in PPP international dollars.

USA: The United States has the world’s second-highest GDP based on PPP (after China), underscoring its immense economic output across virtually every sector, from technology and finance to manufacturing and energy. In terms of GDP PPP per capita, the U.S. ranks very high, reflecting widespread individual consumption, innovation, and a robust labor market. The American economy benefits from strong productivity, deep capital markets, and a large, affluent population. However, disparities in income, healthcare access, and regional development persist, even as the U.S. remains a global leader in overall and per capita economic power.

USA GDP PPP

South Korea GDP PPP

South Korea economy size measured in Power Purchasing Parity, i.e. comparing relative standard of living and ability to afford goods and services. South Korea’s Gross Domestic Product (GDP) chart showing historical economic growth as measured in PPP international dollars.

South Korea: South Korea’s GDP PPP reflects its transformation into a highly industrialized and export-oriented economy, known for leading global brands in electronics, automotive, and shipbuilding. Overall GDP PPP is substantial, supported by technological innovation and strong infrastructure. Per capita GDP PPP is also high, underlining South Korea’s elevated standard of living, widespread digital connectivity, and strong education system. Despite its success, the economy faces headwinds from low birth rates and intense competition in global markets, but remains one of Asia’s most advanced and efficient economies by PPP measures.

South Korea GDP PPP

Spain GDP PPP

Spain economy size measured in Power Purchasing Parity, i.e. comparing relative standard of living and ability to afford goods and services. Spain’s Gross Domestic Product (GDP) chart showing historical economic growth as measured in PPP international dollars.

Spain: Spain has a sizable GDP PPP, consistent with its status as one of the larger economies in the Eurozone. The country’s economy is fueled by tourism, manufacturing, and services, with growing strength in renewables and tech sectors. Per capita GDP PPP is relatively high, though still below the EU’s top economies, reflecting the lingering effects of past financial crises and a still-elevated unemployment rate in some regions. Nonetheless, Spain maintains a strong social welfare system, modern infrastructure, and a resilient middle class, which contribute to a solid per capita standing in PPP terms.

Spain GDP PPP

Turkey GDP PPP

Turkey economy size measured in Power Purchasing Parity, i.e. comparing relative standard of living and ability to afford goods and services. Turkey’s Gross Domestic Product (GDP) chart showing historical economic growth as measured in PPP international dollars.

Turkey: Turkey’s GDP PPP is significant, placing it among the largest emerging markets due to its large population and diversified economy that includes manufacturing, agriculture, and services. The PPP adjustment emphasizes Turkey’s large domestic market and relatively lower costs, boosting its global GDP ranking. However, GDP PPP per capita is in the middle range, reflecting the country’s ongoing battle with inflation, currency volatility, and income disparity. Despite economic challenges, Turkey remains a dynamic player between Europe and Asia, with strategic importance and a growing industrial base.

Turkey GDP PPP

France GDP PPP

France economy size measured in Power Purchasing Parity, i.e. comparing relative standard of living and ability to afford goods and services. France’s Gross Domestic Product (GDP) chart showing historical economic growth as measured in PPP international dollars.

France: France’s GDP PPP reflects the strength of one of the largest economies in Europe, driven by a diverse industrial base, robust public services, and global cultural influence. The country ranks high in overall PPP-adjusted GDP, benefiting from strong exports in aerospace, luxury goods, and agriculture. Its per capita GDP PPP is also high, indicating a well-distributed economic output and a generally affluent population. France combines a tradition of state intervention with market dynamics, and its standard of living remains among the highest in the EU, despite occasional structural and labor market challenges.

France GDP PPP

Japan GDP PPP

Japan economy size measured in Power Purchasing Parity, i.e. comparing relative standard of living and ability to afford goods and services. Japan’s Gross Domestic Product (GDP) chart showing historical economic growth as measured in PPP international dollars.

Japan: Japan holds one of the highest overall GDP PPP rankings globally, a reflection of its highly advanced, technology-driven economy and substantial domestic market. Although its population has been declining, Japan maintains strong economic output through high productivity, innovation in sectors like robotics and electronics, and a solid export base. GDP PPP per capita is also high, showcasing the country’s well-developed infrastructure, high life expectancy, and quality public services. However, long-term economic pressures from demographic aging and deflation persist, even as Japan continues to maintain a very high standard of living.

Japan GDP PPP

Italy GDP PPP

Italy economy size measured in Power Purchasing Parity, i.e. comparing relative standard of living and ability to afford goods and services. Italy’s Gross Domestic Product (GDP) chart showing historical economic growth as measured in PPP international dollars.

Italy: Italy’s GDP PPP reflects the strength of a diversified industrial economy within the Eurozone, marked by a mix of advanced manufacturing, fashion, tourism, and agriculture. While its overall GDP PPP is sizable, placing it among the world’s top economies, it’s somewhat constrained by slow growth and structural inefficiencies. Per capita GDP PPP is relatively high, indicating a decent standard of living and strong infrastructure, though it’s slightly below the EU’s top-tier economies. Italy’s regional disparities — with a wealthier north and a less developed south — are evident in per capita figures and remain a challenge to balanced economic development.

Italy GDP PPP

Mexico GDP PPP

Mexico economy size measured in Power Purchasing Parity, i.e. comparing relative standard of living and ability to afford goods and services. Mexico’s Gross Domestic Product (GDP) chart showing historical economic growth as measured in PPP international dollars.

Mexico: Mexico’s GDP PPP is among the largest in Latin America, thanks to its large population, rich natural resources, and close economic ties with the United States. Its total PPP-adjusted GDP is boosted by a robust manufacturing sector, especially automotive and electronics, and growing services. However, GDP PPP per capita is moderate, reflecting persistent income inequality, informal labor markets, and regional economic gaps. Despite these issues, Mexico’s middle class is expanding, and structural reforms along with trade integration under USMCA continue to support economic modernization and per capita growth.

Mexico GDP PPP

Indonesia GDP PPP

Indonesia economy size measured in Power Purchasing Parity, i.e. comparing relative standard of living and ability to afford goods and services. Indonesia’s Gross Domestic Product (GDP) chart showing historical economic growth as measured in PPP international dollars.

Indonesia: Indonesia’s overall GDP PPP positions it as a major player among emerging markets, underpinned by a large population and diverse economy spanning manufacturing, services, and resource extraction. Its GDP PPP is among the highest in Southeast Asia, showing strong aggregate output. However, per capita GDP PPP is still relatively low, reflecting the country’s development status and the income gap across its many islands and regions. Despite this, Indonesia is progressing steadily, with growing urbanization, increased digital connectivity, and structural reforms supporting improvements in living standards and economic inclusiveness.

Indonesia GDP PPP

Australia GDP PPP

Australia economy size measured in Power Purchasing Parity, i.e. comparing relative standard of living and ability to afford goods and services. Australia’s Gross Domestic Product (GDP) chart showing historical economic growth as measured in PPP international dollars.

Australia: Australia’s GDP based on Purchasing Power Parity reflects a highly developed, resource-rich economy that combines significant natural exports with a service-driven domestic market. In terms of overall PPP-adjusted GDP, Australia ranks relatively high given its smaller population, demonstrating its economic strength on the global stage. However, it truly stands out in GDP PPP per capita, which is among the highest in the world. This high per capita value indicates a strong standard of living, widespread access to goods and services, and a well-distributed economic output across its population. Australia’s economic performance is driven by sectors like mining, finance, and education, with substantial exports to Asia, particularly China.

Australia GDP PPP