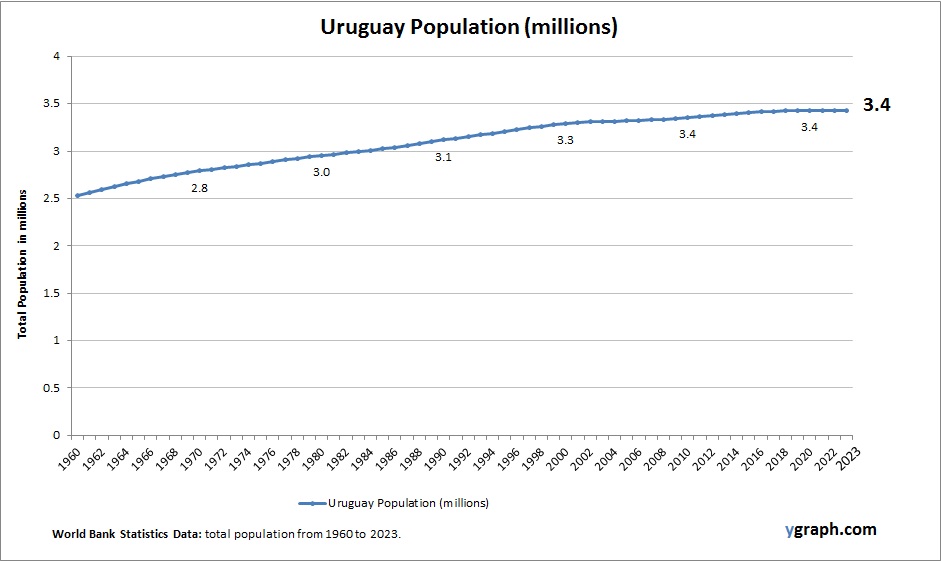
Gibraltar Births per woman

Chart above demonstrates Gibraltar Births per woman. The fertility rate statistics are compiled by World Bank. Based on the latest demographics info provided for Gibraltar.

Gibraltar has low fertility rates typical of highly developed urbanized areas. Population growth is slow and influenced by migration related to its economic and geopolitical status. The territory’s small size and dense population shape demographic patterns, with efforts to maintain social services and infrastructure.

Gibraltar Births per woman

Botswana Population

Chart above demonstrates Botswana Population. World Bank is the source of this population data. Based on the latest demographics info provided for Botswana.

Botswana has a growing population with a relatively young age structure, shaped by moderate fertility rates and improvements in healthcare. Urbanization is increasing, particularly in the capital Gaborone, while rural areas still retain significant population shares. Economic development and HIV/AIDS management influence demographic dynamics.

Botswana Population

Oman Population

Chart above demonstrates Oman Population. The country statistics are compiled by World Bank. Latest population information for Oman.

Oman’s population is growing steadily, with a notable portion made up of expatriates who contribute to the country’s labor force, especially in construction, oil, and service sectors. The native Omani population is relatively young, and while the fertility rate has declined in recent years, it remains higher than many developed nations. Government investment in health and education is shaping future demographic trends.

Oman Population

Central Europe and the Baltics Births per woman

This diagram presents Central Europe and the Baltics Births per woman. World Bank is the source of this birth data. Based on the latest demographics info provided for Central Europe and the Baltics.

Fertility rates across Central Europe and the Baltics remain below replacement level, despite various family-friendly policies. Economic migration and aging are significant issues, and regional governments are working to incentivize higher birth rates.

Central Europe and the Baltics Births per woman

Croatia Births per woman

Chart above demonstrates Croatia Births per woman. This is according to World Bank birth stats by country. Based on the latest demographics info provided for Croatia.

Croatia has low fertility rates below replacement level, contributing to population decline and aging. Migration, particularly of young people to other EU countries, exacerbates demographic challenges. Urban centers maintain more stable populations, but rural areas face significant decline. Efforts are being made to encourage family growth.

Croatia Births per woman

South Asia Births per woman

This diagram presents South Asia Births per woman. World Bank is the source of this birth data. Latest births per woman information for South Asia.

South Asia exhibits a wide range of fertility rates, generally declining due to increased urbanization, education, and access to healthcare. However, birth rates remain higher in rural and less developed areas, contributing to a large and youthful population.

South Asia Births per woman

Middle East & North Africa (excluding high income) Population

Chart above demonstrates Middle East & North Africa (excluding high income) Population. World Bank is the source of this population data. Based on the latest available information for Middle East & North Africa (excluding high income).

The population in the Middle East and North Africa (excluding high-income countries) is characterized by a predominantly young demographic with relatively high fertility rates compared to more developed regions. Rapid urbanization, ongoing political changes, and varied economic development levels shape diverse population dynamics across countries. Many face challenges related to youth unemployment, education access, and healthcare infrastructure, while social and cultural factors continue to influence family size. Migration, both internal and international, also plays a significant role, driven by conflict, economic opportunities, and environmental factors.

Middle East & North Africa (excluding high income) Population

Albania Population

This diagram presents Albania Population. World Bank is the source of this population data. Based on the latest demographics info provided for Albania.

Albania’s population is slowly declining due to low fertility rates and significant emigration, particularly among the youth. The demographic structure is aging, with many younger citizens seeking work abroad. The government is attempting to reverse this trend with incentives for returnees and support for families.

Albania Population

Moldova Births per woman

The above graph shows Moldova Births per woman. World Bank is the source of this birth data. Latest births per woman information for Moldova.

Moldova has low fertility rates, consistent with Eastern European trends of population aging and decline. Economic migration and urbanization contribute to demographic shifts, with efforts ongoing to support family welfare and stabilize population numbers.

Moldova Births per woman