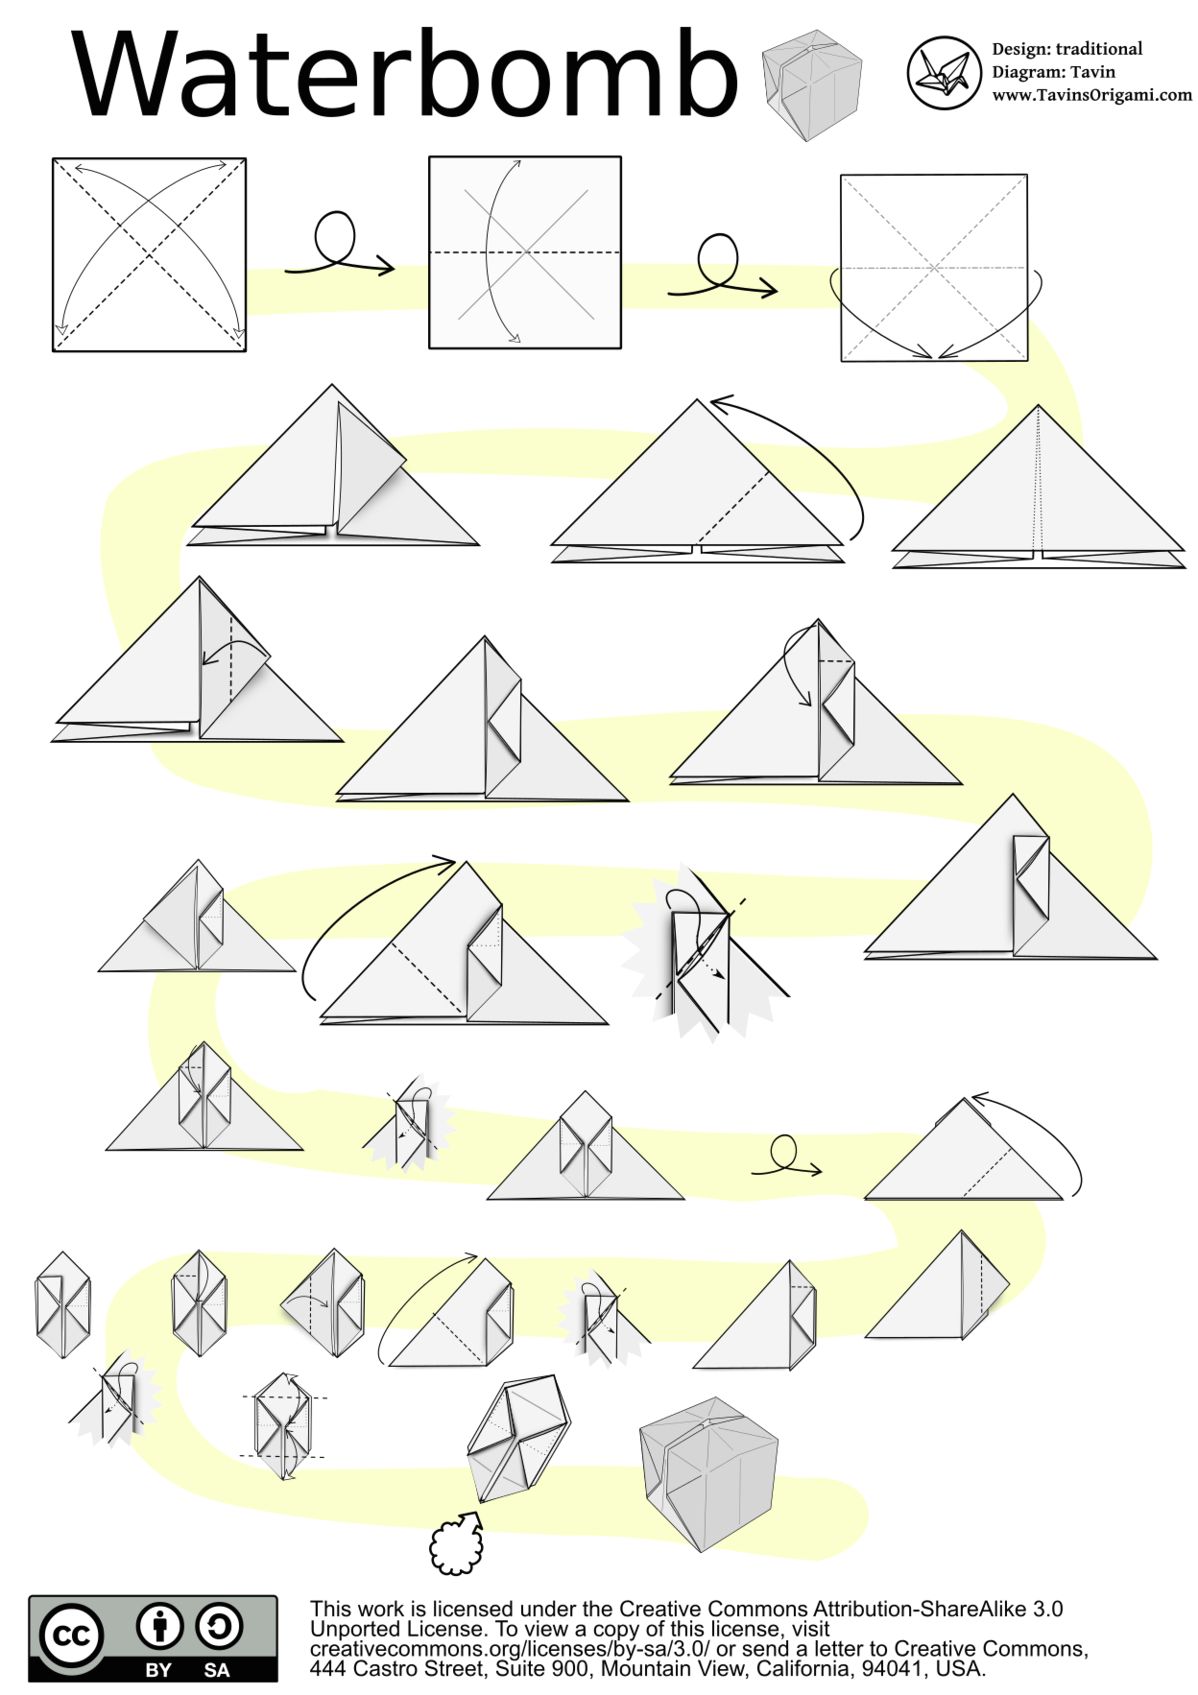
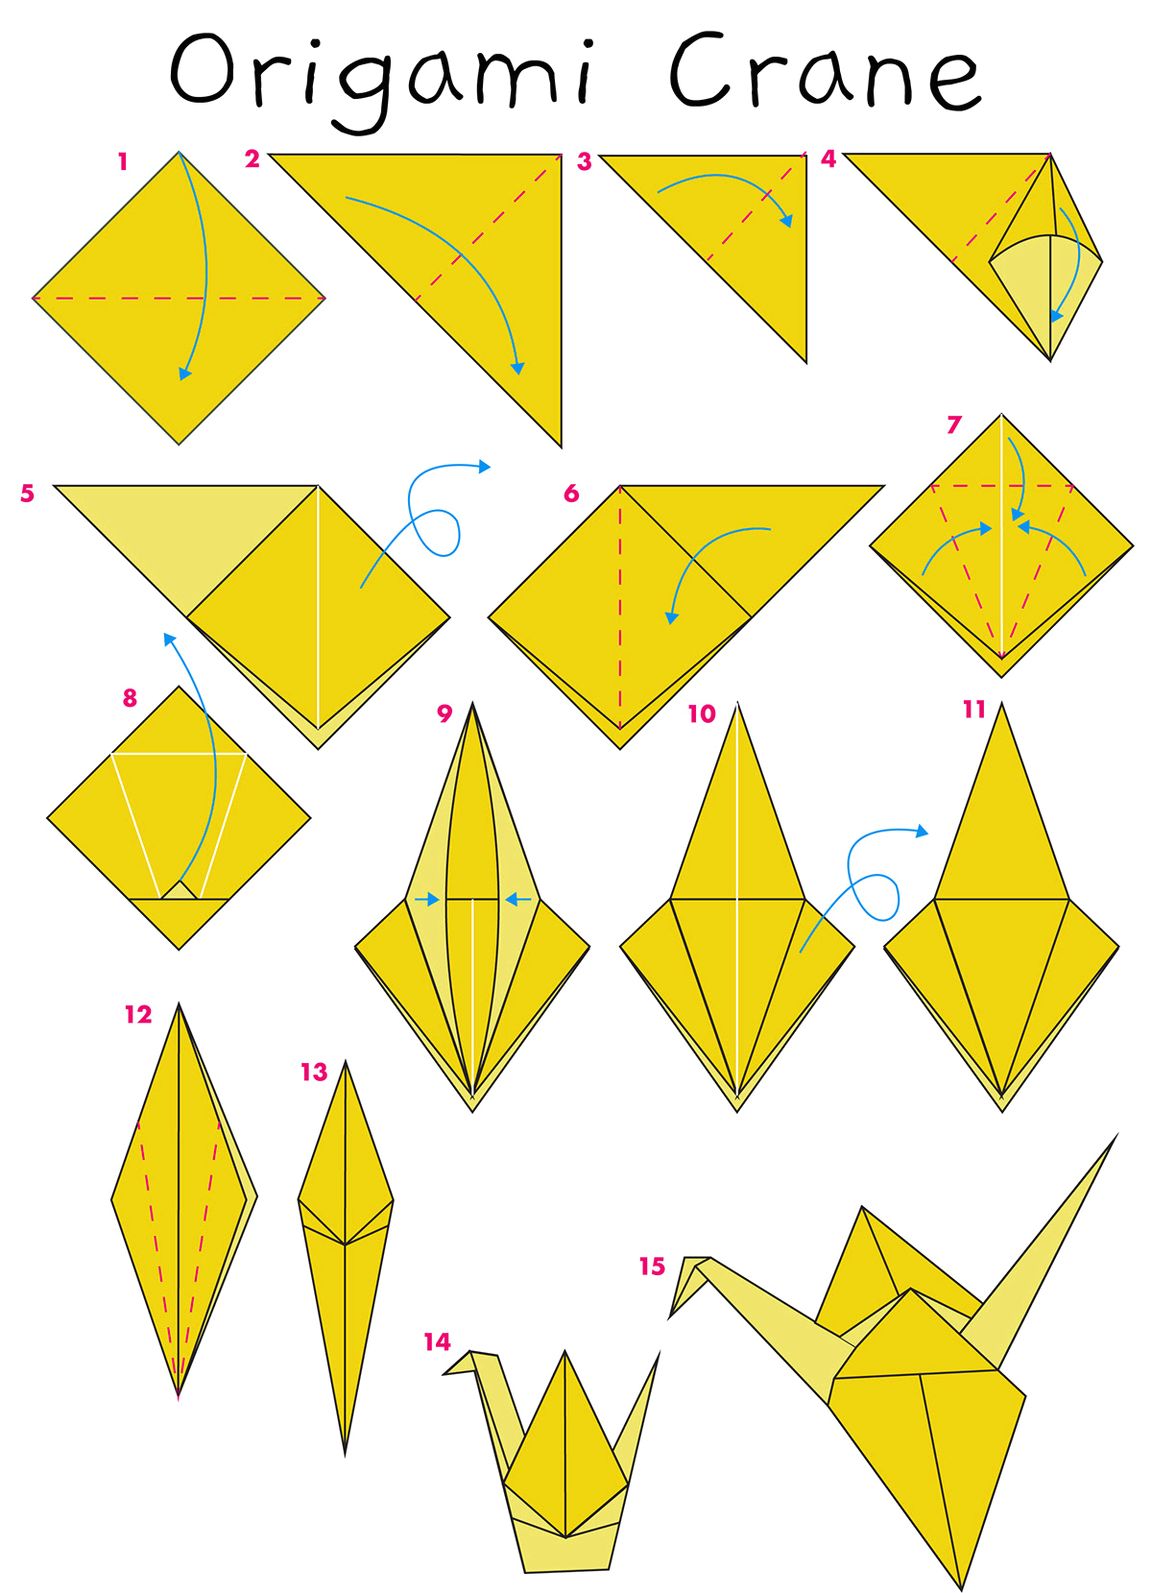
See the below image for the Crane origami instructions diagram.

Your Graphs, Charts and Diagrams
Movie rating system indicates which movies are safe to watch for children and teenagers. G rating is safe for all audiences. PG rating indicates some parenta guidance may be requires for certain topics raised in the movie. PG-13 rating shows that some material may be inappropriate for kids under 13.
R movie rating stands for Restricted and there will be some Adult material that parents need to be mindful of. Finally, NC-17 is the strictest film rating with no kids admitted.
Computer Workstation – Computer Desk – Computer Workstations – Computer Seating Chart – Comp Seating Chart – Workstation Seating Diagram. Ergonomic workstation workstation chart – office desk – seating chart. Source: intelihealth computer workstation
Born in the USA Infographic. Source: http://www.insurancequotes.com/united_states-pregnancy/#.UREnM6U1bFI https://ygraph.com/chart/3022
The Worst Places to Drive Infographic. Source: http://www.motortradeinsurance.org/worst-places-drive https://ygraph.com/chart/3024
Their Job is to Look After Israel, Ours is to Look After Them Infographic. Source: http://fidf.info/fidf_summary.htm https://ygraph.com/chart/3027
Are Computers Breaking Our Hearts? Infographic. Source: http://www.crucial.com/company/love-computers/Are-Computers-Breaking-Our-Hearts.html https://ygraph.com/chart/3035
The NYC Letter Grade System Infographic. Source: http://lettergradeconsulting.com/wordpress/wp-content/uploads/2013/02/eating-safely-in-nyc1.htm https://ygraph.com/chart/3046
America’s Most Hated Companies Infographic. Source: http://www.greatbusinessschools.org/love-em-or-hate-em/?fb_action_ids=567570188764&fb_action_types=og.likes&fb_source=timeline_og&action_object_map=%7B%22567570188764%22%3A254529501348620%7D&action_type_map=%7B%22567570188764%22%3A%22og.likes%22%7D&action_ref_map=%5B%5D https://ygraph.com/chart/3051
23 Things About #23 (Michael Jordan) Infographic. Source: http://www.top10onlinecolleges.org/michael-jordan/ https://ygraph.com/chart/3057