Skip to content
cropped logo

Ygraph

Charts, Graphs and Diagrams

Menu

Primary menu

  • Submit Diagram
  • Science
  • Business
  • Economy
    • GDP
  • Demographics
  • Explained
    • Signs
    • Maps
  • Health
  • Anatomy
  • Sizes

Tag Archives: interactive visuals for science

Online Science Diagram

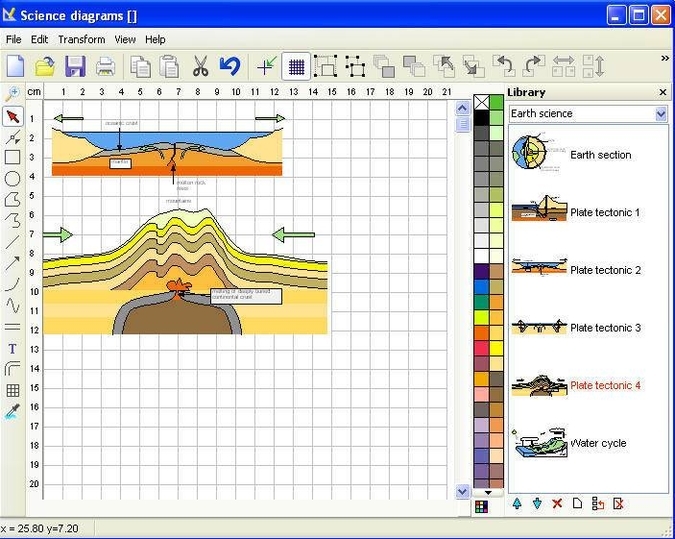
Online Science Diagram: An online science diagram is a digital visual tool used to illustrate scientific concepts. These diagrams can be interactive, allowing users to explore and manipulate the visual elements for better understanding.

Online Science Diagram
Posted in chart | Tagged digital science diagrams, educational science chart software, interactive visuals for science, online diagram tools, science e-learning visuals

Primary Sidebar Widget Area

Top Diagrams

Latest Posts

  • How to Stop Time from Flying
  • Political System Of The United States
  • Yemen Births per woman
  • Shifting Cultivation
  • Nigeria Births per woman
  • img 3782 1.jpg
  • Puerto Rico Population
  • British Virgin Islands Births per woman
  • Morocco Population
  • Maldives Births per woman
  • Greece Births per woman
  • El Salvador Births per woman
  • Smart Farming
  • Two Sector Economy
  • Mesophiles Bacteria Diagram
  • Europe & Central Asia Births per woman

Top Tags

  • sizes (35)
  • size chart (35)
  • size conversion (35)
  • economy chart (33)
  • economy graph (33)
  • economy diagram (33)
  • cell (29)
  • cell diagram (29)
  • cell illustration (29)
  • window (24)
  • window diagram (24)
  • types of windows (24)
  • origami (16)
  • origami steps (16)
  • how to make origami (16)
  • biology (16)
  • biology diagram (16)
  • yoga (8)
  • yoga routine (8)
  • yoga poses (8)

Categories

  • anatomy
  • Business
  • chart
  • Demographics
  • Eco
  • Ecom
  • Economy
  • Explained
  • GDP
  • Health
  • Maps
  • notice
  • science
  • Signs
  • Sizes
  • Uncategorized

Useful Resources

  • Chart Diagram
  • Meme Gif
  • Logo Sign
  • Human Anatomy
  • Graph Diagram
  • Economy GDP
  • Twitter
Copyright © 2026 Ygraph. All Rights Reserved.
Theme: Catch Box by Catch Themes
Scroll Up
WP Twitter Auto Publish Powered By : XYZScripts.com