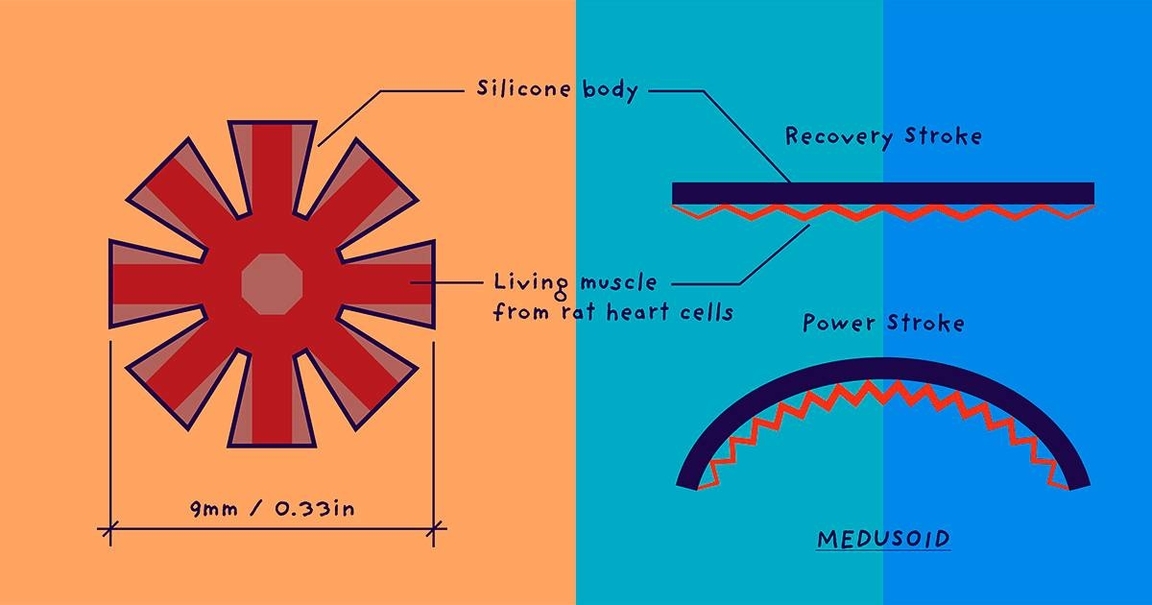
Science Diagrams Explanation: Science diagrams are visual tools used to represent scientific concepts, processes, and data. They simplify complex information, making it easier to understand and communicate scientific ideas effectively.

Charts, Graphs and Diagrams