Data Science Venn Diagram Explained

Data Science Venn Diagram Explained: The data science Venn diagram typically includes three overlapping circles representing domain expertise, statistics and mathematics, and computer science. The intersection of these areas highlights the interdisciplinary nature of data science, emphasizing the skills needed to extract insights from data.

Data Science Venn Diagram Explained

Physics Drawings

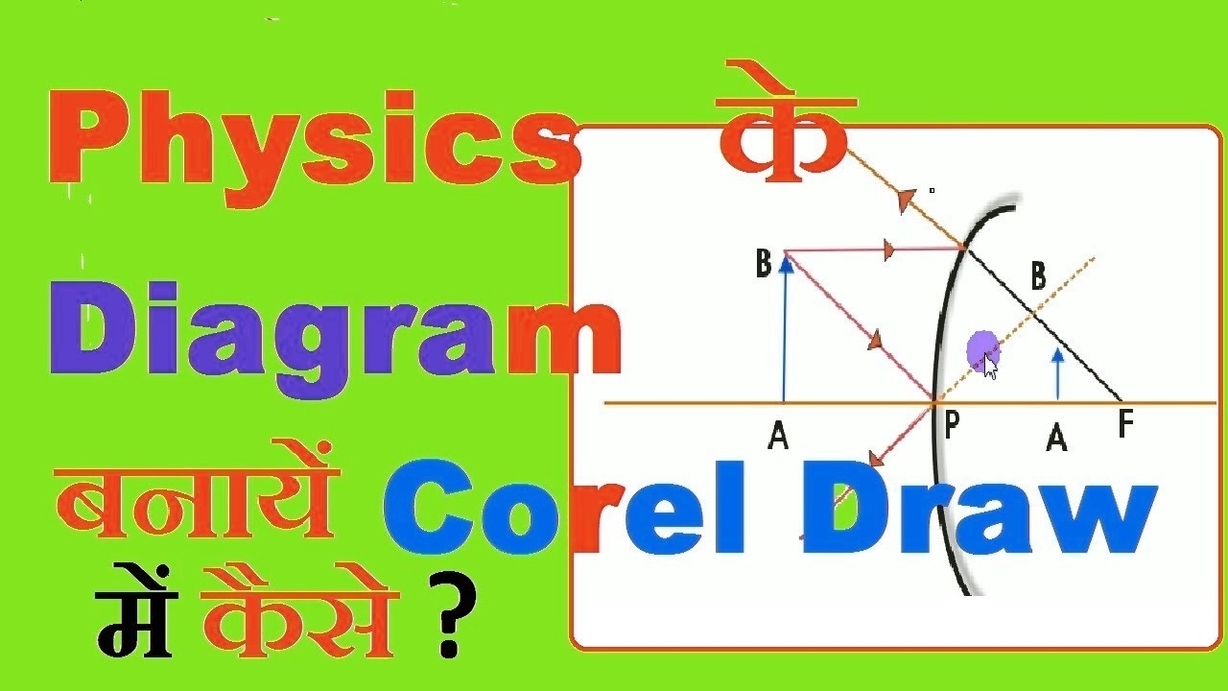
Physics drawings are a visual representation of physical concepts and phenomena. They can be used to illustrate the behavior of objects in motion, the properties of waves, the structure of atoms, and much more. Physics drawings can be created using a variety of tools, including pencils, pens, markers, and computer software.

One popular tool for creating physics drawings is oPhysics Mechanics Drawing Tools . This tool provides a collection of movable pieces such as masses, pulleys, inclines, springs, and more, which can be used to create custom diagrams. You can also use the built-in drawing tools or free draw to create your own diagrams. The tool also provides options to customize your diagrams by turning the grid-snap on or off, adjusting the line thickness, and changing the colors of objects.

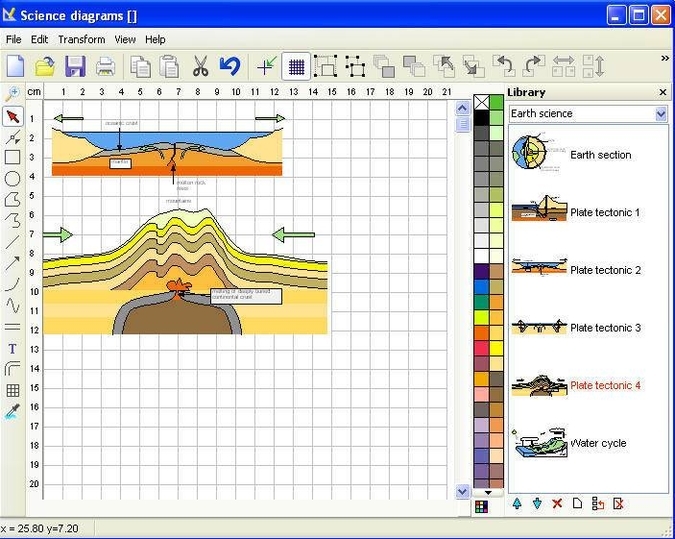
Another way to create physics drawings is to use vector graphics software such as Adobe Illustrator or Inkscape. These tools allow you to create precise and detailed drawings that can be easily edited and scaled. You can also use these tools to create animations and interactive simulations that help to illustrate complex physical concepts.

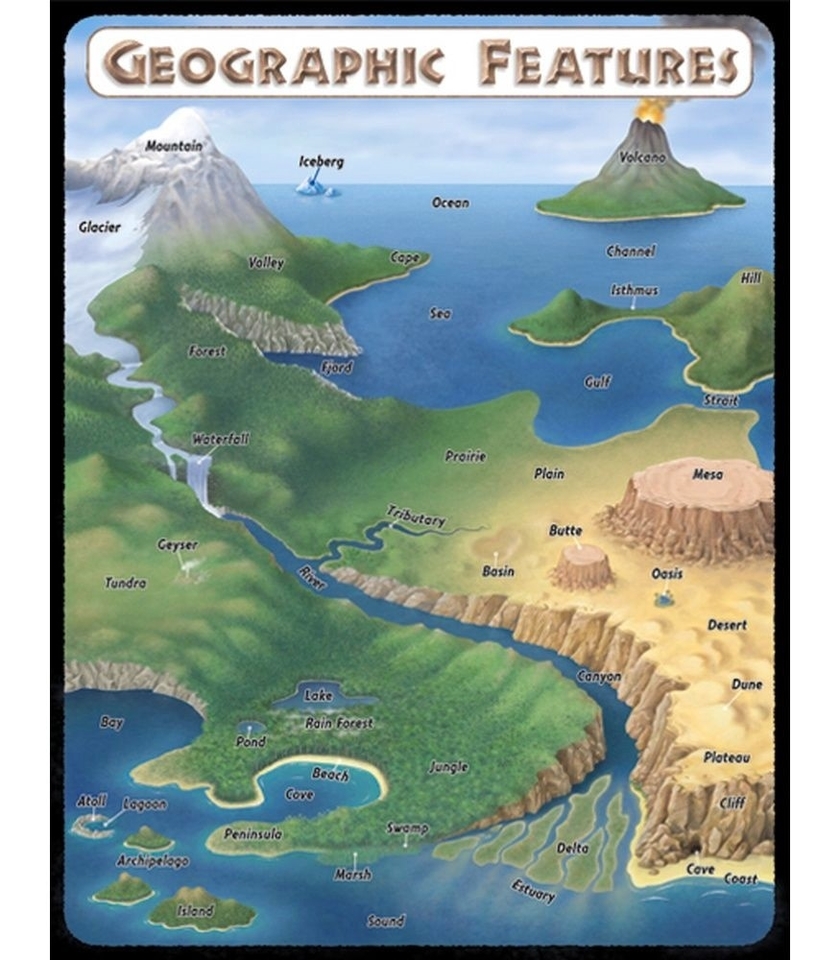
There are many different types of physics drawings, ranging from simple diagrams to complex illustrations. Some common types of physics drawings include free-body diagrams, energy diagrams, wave diagrams, and atomic structure diagrams. Free-body diagrams are used to illustrate the forces acting on an object, while energy diagrams are used to show the energy changes that occur during a physical process. Wave diagrams are used to illustrate the properties of waves, such as wavelength and amplitude, while atomic structure diagrams are used to show the arrangement of electrons in an atom.

In conclusion, physics drawings are an important tool for understanding and communicating physical concepts and phenomena. They can be created using a variety of tools and software, and can range from simple diagrams to complex illustrations. Whether you’re a student, teacher, or researcher, physics drawings can help you to visualize and understand the world around you.

Physics Drawings

Conservation Of Agriculture Diagram

Conservation Agriculture (CA) is a farming system that aims to protect soil from erosion and degradation, and then increase crop yields. It promotes maintenance of a permanent soil cover, minimum soil disturbance, and diversification of plant species . CA is a sustainable approach method to improve agricultural production . The principles of CA are universally applicable to all agricultural landscapes and land uses with locally adapted practices . Soil interventions such as mechanical soil disturbance are reduced to an absolute minimum or avoided, and external inputs such as agrochemicals and plant nutrients of mineral or organic origin are applied optimally and in ways and quantities that do not interfere with, or disrupt, the biological processes . CA facilitates good agronomy, such as timely operations, and improves overall land husbandry for rainfed and irrigated production .

The benefits of CA are numerous. It can prevent losses of arable land while regenerating degraded lands . It enhances biodiversity and natural biological processes above and below the ground surface, which contribute to increased water and nutrient use efficiency and to improved and sustained crop production . CA is a base for sustainable agricultural production intensification. It opens increased options for integration of production sectors, such as crop-livestock integration and the integration of trees and pastures into agricultural landscapes .

CA is a management system that can prevent the loss of land suitable for cultivation and contribute to the restoration of degraded soils . It is a sustainable approach to agriculture that can help farmers to produce more food with fewer resources . CA is a promising solution to the challenges of food security and climate change . By adopting CA, farmers can reduce their environmental footprint and increase their resilience to climate change .

In conclusion, Conservation Agriculture is a sustainable approach to agriculture that can help farmers to produce more food with fewer resources. It promotes maintenance of a permanent soil cover, minimum soil disturbance, and diversification of plant species. The principles of CA are universally applicable to all agricultural landscapes and land uses with locally adapted practices. By adopting CA, farmers can reduce their environmental footprint and increase their resilience to climate change. CA is a promising solution to the challenges of food security and climate change..

Conservation Of Agriculture Diagram

Geographic Features Chart

Geographic features are physical characteristics of the Earth’s surface that can be natural or man-made. These features are often used to describe and understand the Earth’s landscape. Some of the most common geographic features include mountains, valleys, rivers, lakes, oceans, and plains. These features are formed by a variety of natural processes such as erosion, volcanic activity, and tectonic plate movement.

Mountains are one of the most prominent geographic features on Earth. They are formed by the movement of tectonic plates and can be found on every continent. The highest mountain in the world is Mount Everest, which stands at 29,031.7 feet above sea level. Valleys are low-lying areas between mountains or hills. They are often formed by the erosion of rock and soil by water or ice. Rivers are bodies of water that flow from higher elevations to lower elevations. They are often formed by the melting of snow and ice in mountainous regions. Lakes are bodies of water that are surrounded by land. They can be formed by a variety of natural processes such as glacial activity or volcanic activity. Oceans are large bodies of saltwater that cover most of the Earth’s surface. They are formed by a combination of tectonic plate movement and volcanic activity.

In addition to natural geographic features, there are also many man-made geographic features. These features are often created for specific purposes such as transportation, irrigation, or energy production. Some examples of man-made geographic features include canals, dams, and highways. Canals are artificial waterways that are used for transportation or irrigation. Dams are structures that are built across rivers to control the flow of water and generate electricity. Highways are roads that are designed for high-speed transportation of vehicles.

In conclusion, geographic features are an important part of the Earth’s landscape. They are formed by a variety of natural processes and can be used to describe and understand the world around us. Whether natural or man-made, these features play an important role in shaping the Earth’s environment and the way we live our lives.

: [source](https://en.wikipedia.org/wiki/Mount_Everest)

Geographic Features Chart

Four Sector Circular Flow Model

Four Sector Circular Flow Model: The four-sector circular flow model represents the economy, including households, businesses, government, and foreign sectors. It illustrates the flow of goods, services, and money between these sectors, highlighting the interdependence and economic activities within an open economy.

Four Sector Circular Flow Model

Cognitive Behavioral Therapy Model

Cognitive Behavioral Therapy Model: The Cognitive Behavioral Therapy (CBT) model is a psychological treatment approach that focuses on changing negative thought patterns and behaviors. CBT helps individuals identify and challenge distorted thinking, develop healthier coping mechanisms, and improve emotional regulation.

Cognitive Behavioral Therapy Model

Women Clothing sizes

Women Clothing sizes: Women’s clothing sizes vary significantly across different regions and brands. Typically, sizes are categorized into small (S), medium (M), large (L), and extra-large (XL), with numerical sizes ranging from 0 to 20 or higher. Accurate measurements of bust, waist, and hips are essential to determine the correct size, as these dimensions can differ between manufacturers.

Women Clothing sizes