Data Science Venn Diagram Sample

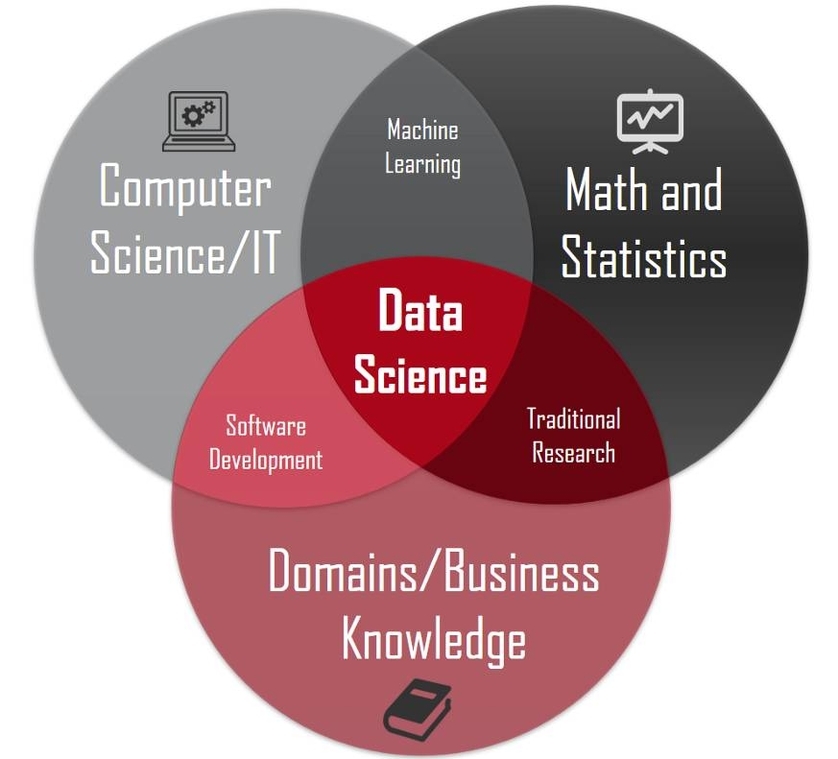
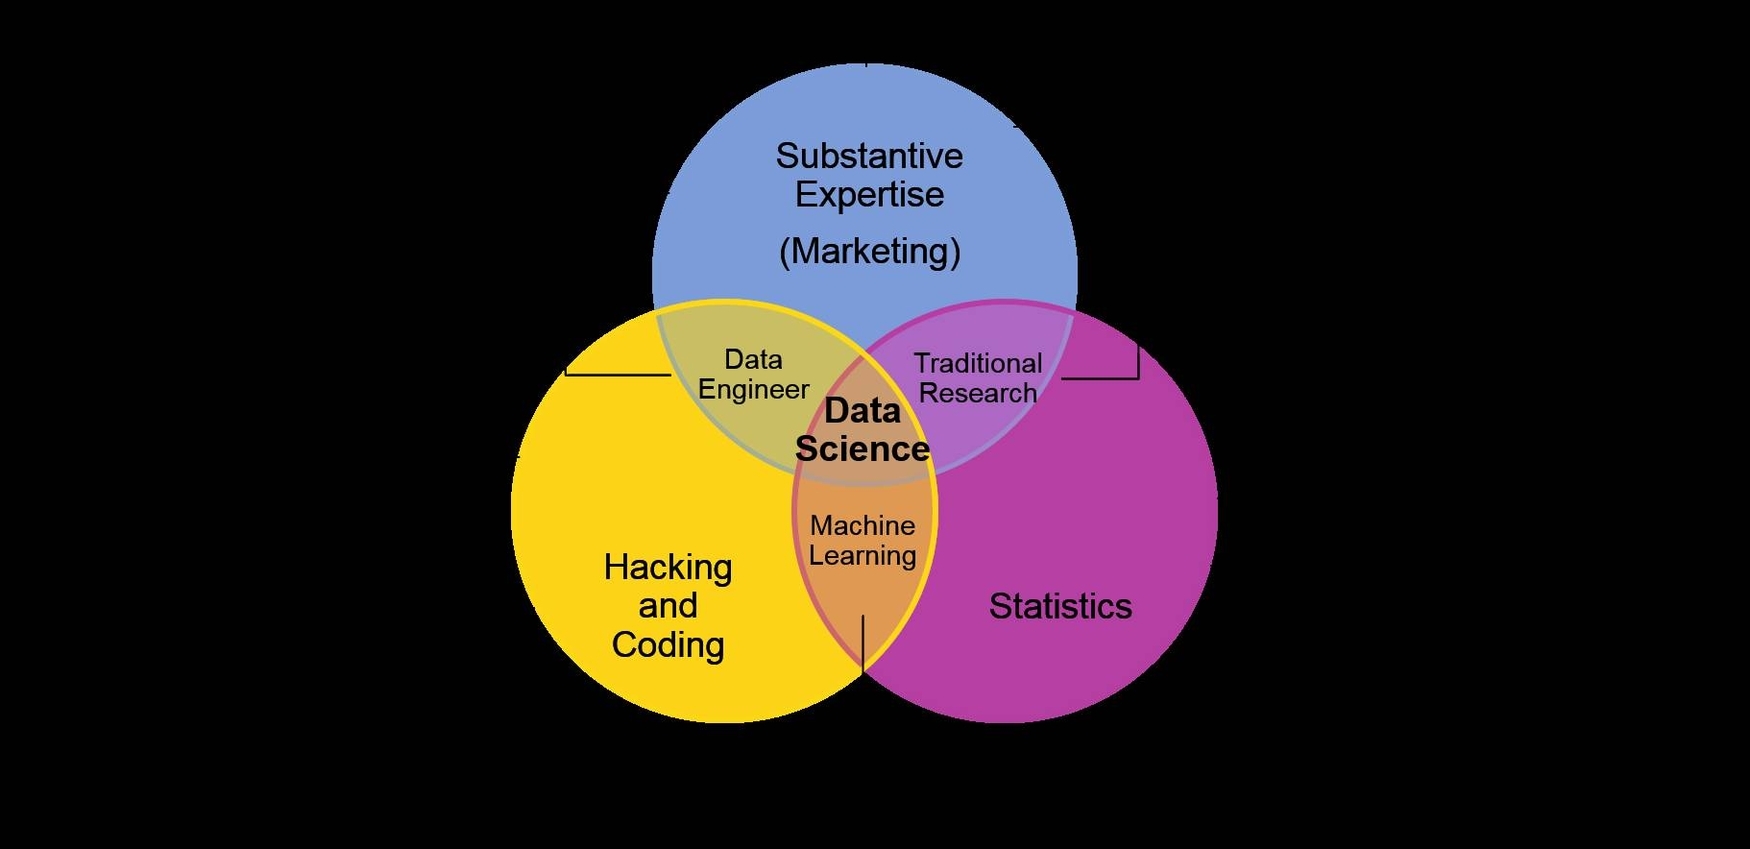
Data Science Venn Diagram Sample: A sample data science Venn diagram illustrates the intersection of domain expertise, statistics and mathematics, and computer science. It highlights the interdisciplinary skills required for data science, emphasizing the integration of knowledge from different fields to analyze and interpret data.

Data Science Venn Diagram Sample

Data Science Venn Diagram Explained

Data Science Venn Diagram Explained: The data science Venn diagram typically includes three overlapping circles representing domain expertise, statistics and mathematics, and computer science. The intersection of these areas highlights the interdisciplinary nature of data science, emphasizing the skills needed to extract insights from data.

Data Science Venn Diagram Explained