Da Lovelace

Augusta Ada King, Countess of Lovelace (née Byron; 10 December 1815 – 27 November 1852) was an English mathematician and writer. She is chiefly known for her work on Charles Babbage’s proposed mechanical general-purpose computer, the Analytical Engine. Ada Lovelace was the first to recognize that the machine had applications beyond pure calculation. She is often regarded as the world’s first computer programmer, as she wrote the world’s first algorithm intended to be processed by a machine.

Ada Lovelace was born in London, England, to the poet Lord Byron and his wife, Anne Isabella Milbanke. Her father left the family when Ada was just a month old, and her mother, Lady Byron, raised her alone. Lady Byron was determined to prevent Ada from developing her father’s perceived insanity, so she encouraged Ada’s interest in mathematics and logic. Despite being often ill in her childhood, Ada pursued her studies assiduously.

In 1833, Ada met Charles Babbage, a British mathematician and inventor who is credited with designing the first mechanical computer. Babbage was working on the Analytical Engine, a proposed mechanical general-purpose computer that could perform any calculation that could be done by a human. Ada became fascinated with the machine and began working with Babbage to develop it further.

Between 1842 and 1843, Ada translated an article by the military engineer Luigi Menabrea about the Analytical Engine. She supplemented the article with an elaborate set of notes, simply called “Notes”. Lovelace’s notes are important in the early history of computers, especially since the seventh one contained what many consider to be the first computer program—that is, an algorithm designed to be carried out by a machine.

Lovelace’s contributions to the field of computer science were not fully recognized until the 1950s, when her notes were republished. Since then, she has been celebrated as a pioneer of computer science and an inspiration to women in STEM fields.

In conclusion, Ada Lovelace was a brilliant mathematician and writer who made significant contributions to the field of computer science. She recognized the potential of Charles Babbage’s proposed mechanical general-purpose computer, the Analytical Engine, and wrote the world’s first algorithm intended to be processed by a machine. Her work has inspired generations of computer scientists and women in STEM fields..
Da Lovelace

Bacteria Cell Diagram

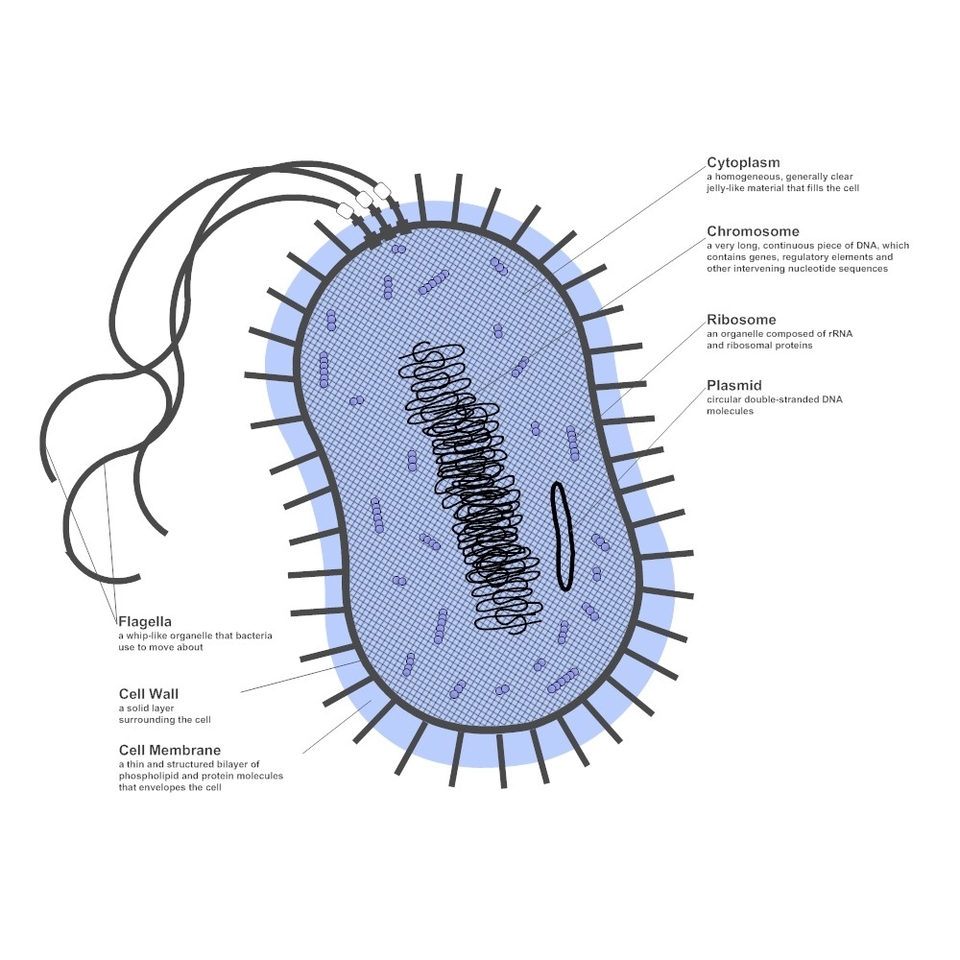
Bacteria are microscopic, single-celled organisms that live in almost every environment on Earth. They are prokaryotes, which means they do not have a nucleus or membrane-bound organelles. Instead, their DNA is circular and located in a region called the nucleoid. Bacteria have different shapes, such as rods, spheres, and spirals. They also have different ways of obtaining energy and nutrients, such as photosynthesis, fermentation, or respiration. Some bacteria are beneficial for humans, plants, and animals, while others can cause diseases or infections. Here is an essay of approximately 1000 words about bacteria cells:

“`
Bacteria are one of the most diverse and abundant groups of organisms on the planet. They are found in almost every habitat, from the deep sea to the human gut. They are also the oldest living forms of life, dating back to at least 3.5 billion years ago. Bacteria are single-celled organisms that belong to the domains Bacteria and Archaea, which are distinct from the domain Eukarya that includes animals, plants, fungi, and protists. Bacteria are prokaryotes, which means they do not have a nucleus or membrane-bound organelles, such as mitochondria or chloroplasts. Instead, they have a simple cell structure that consists of a plasma membrane, a cell wall, cytoplasm, ribosomes, and DNA.

The plasma membrane is a thin layer of phospholipids and proteins that surrounds the cell and regulates the passage of substances in and out of the cell. The cell wall is a rigid layer of peptidoglycan, a polymer of sugars and amino acids, that provides shape and protection to the cell. Some bacteria have an additional outer membrane that contains lipopolysaccharides, which are molecules that trigger immune responses in animals. Some bacteria also have structures that extend from the cell surface, such as flagella, pili, and fimbriae. Flagella are long, whip-like appendages that help the cell move by rotating. Pili and fimbriae are shorter, hair-like projections that help the cell attach to surfaces or exchange genetic material with other cells.

The cytoplasm is the fluid inside the cell that contains water, salts, enzymes, and other

Bacteria Cell Diagram

Workforce Diversity Statistics

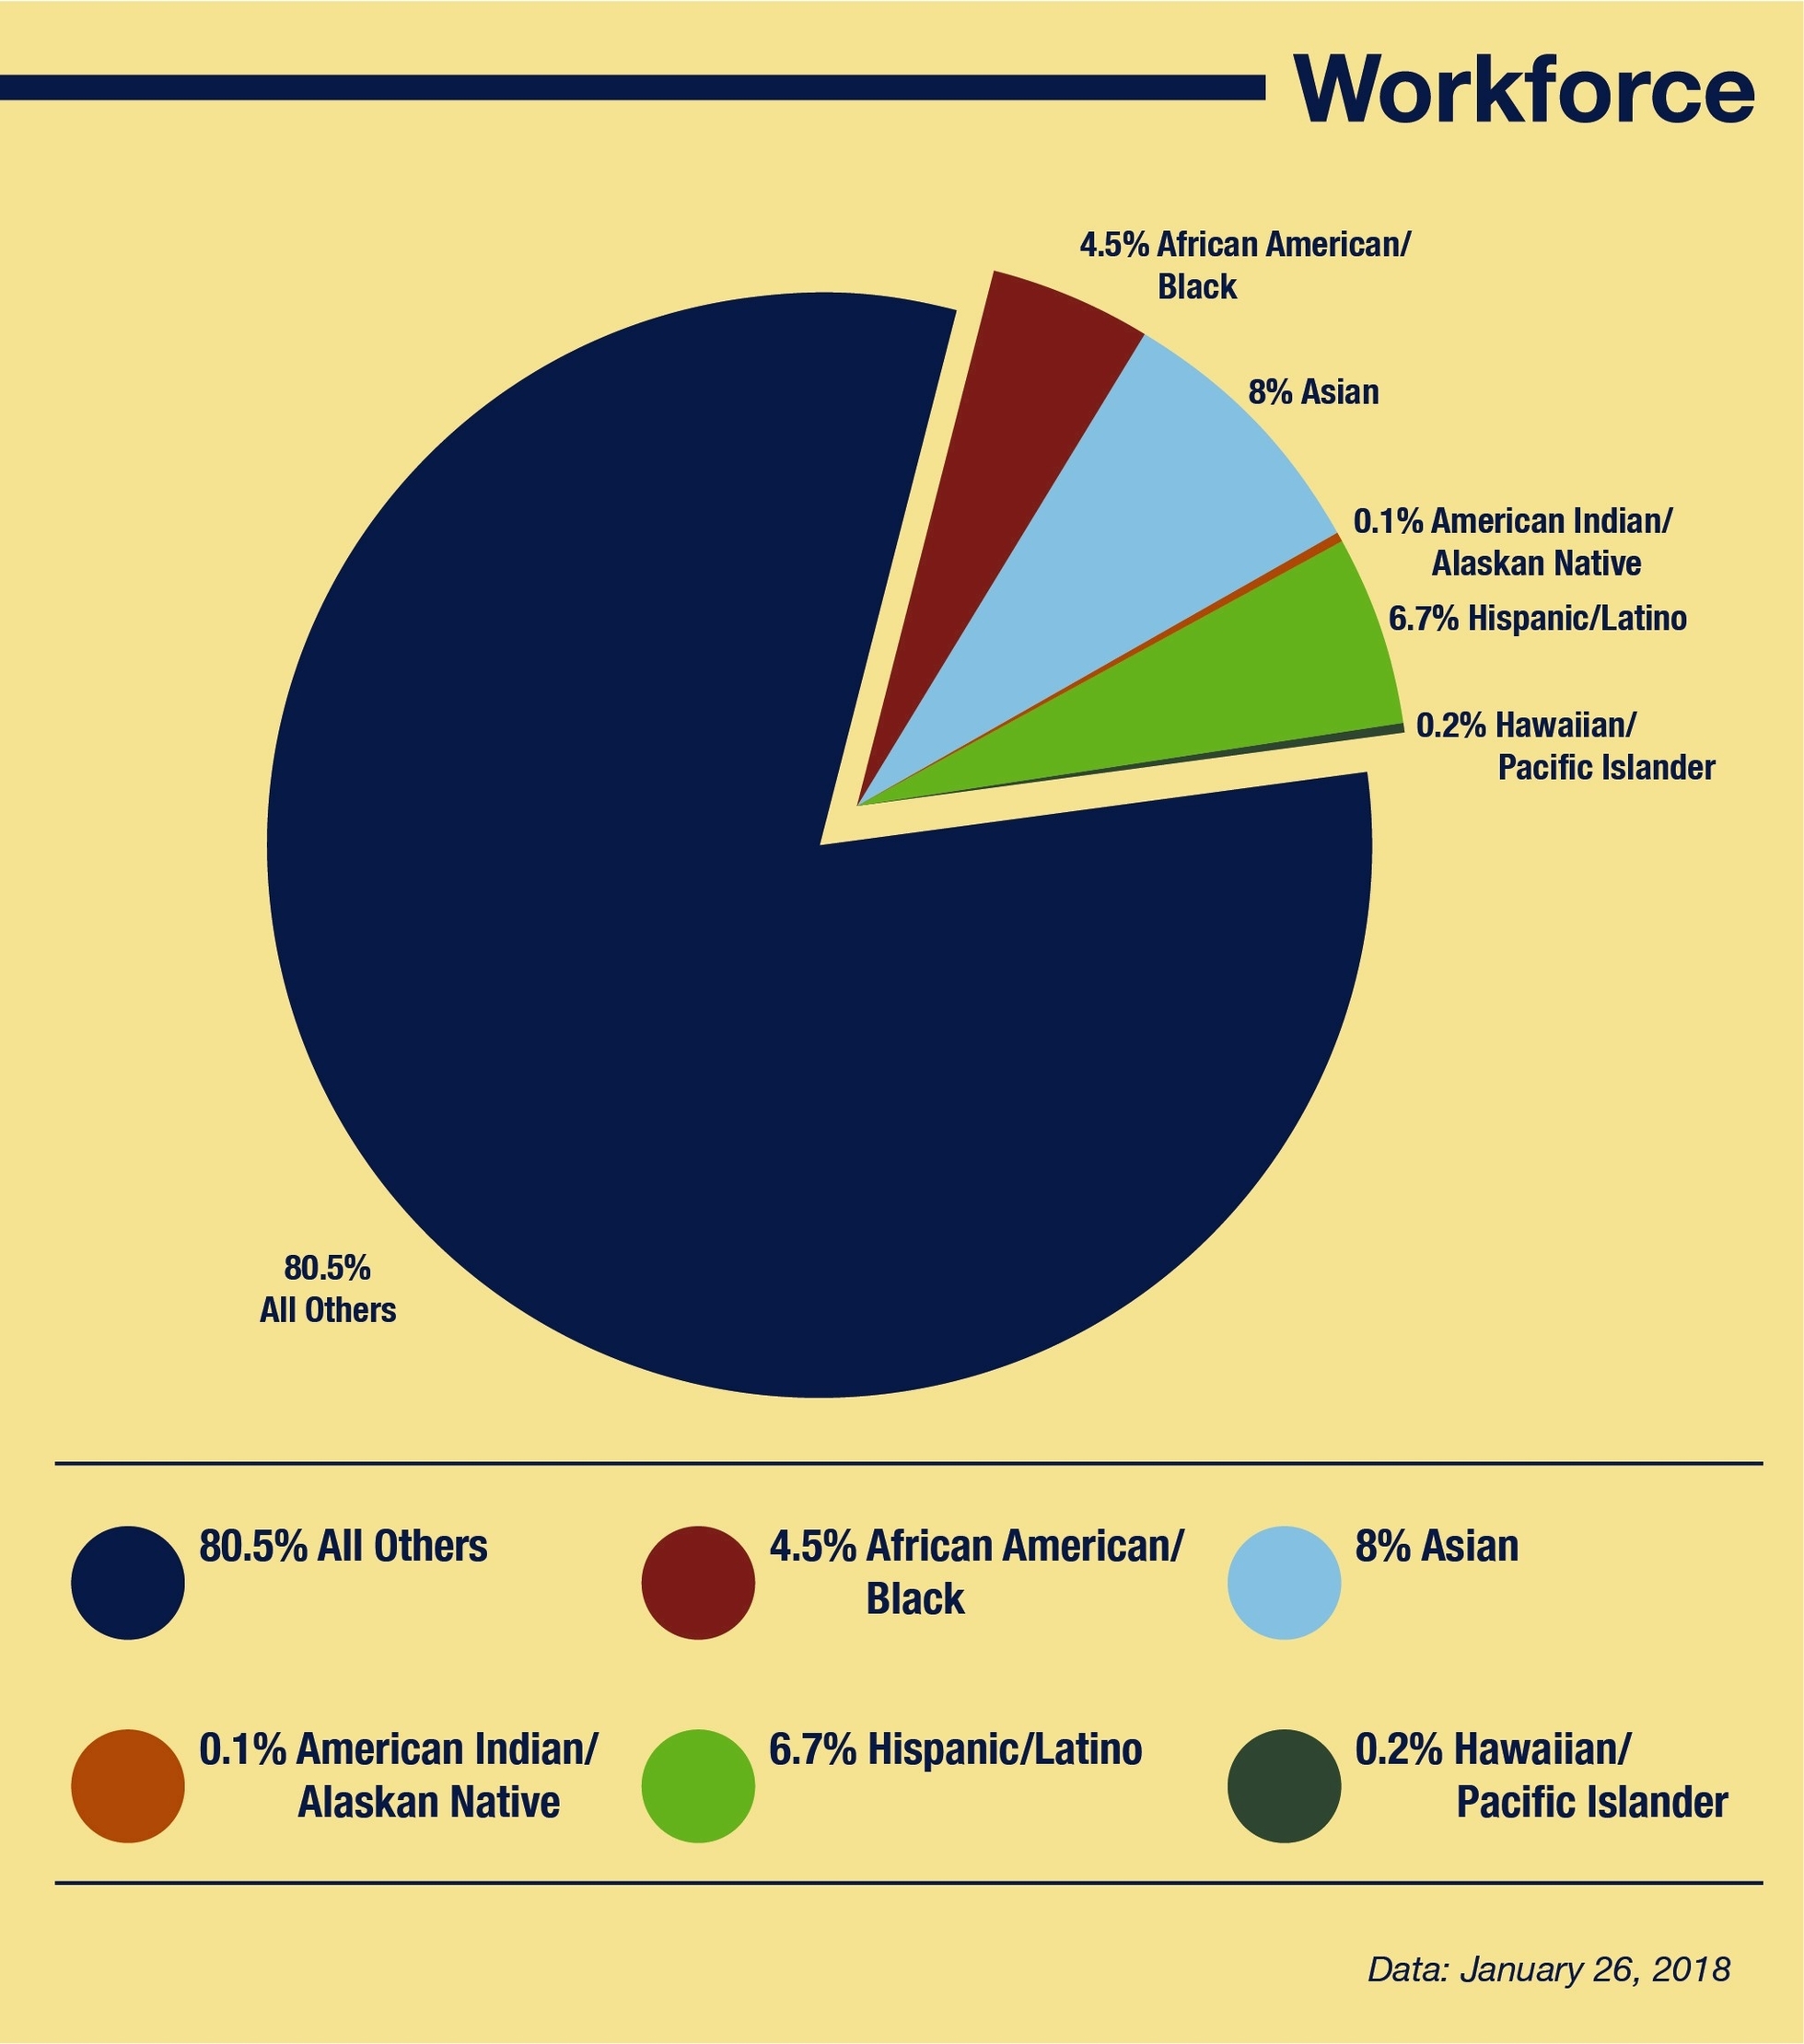
Workforce diversity statistics are a measure of the representation of different groups of people in the workforce. These statistics can help organizations understand how well they are doing in terms of creating a diverse and inclusive workplace. In Canada, the Treasury Board of Canada Secretariat provides static and interactive statistics on employment equity populations in Canada’s public service (core public administration) and information related to diversity as part of the Public Service Employee Survey . The table provides representation data for the four main employment equity designated groups (women, Indigenous peoples, members of visible minorities and persons with disabilities), as well as the overall workforce availability estimates as a benchmark for each of the corresponding groups .

In the United States, the Bureau of Labor Statistics (BLS) provides data on the diversity of the labor force. As of 2022, the U.S. labor force is 77% white, 12.6% Black or African American, 18.5% Hispanic or Latino, and 6.7% Asian . Women make up 46.8% of the U.S. civilian labor force .

Diversity in the workplace has been shown to have many benefits. For example, companies with diverse management have been shown to increase revenue by 19% . Diverse companies enjoy 2.5 times higher cash flow per employee . Gender-diverse companies and executive teams outperform less gender-diverse peers .

It is important to note that diversity statistics are not just about numbers. They are also about creating an inclusive culture where everyone feels valued and respected. This can be achieved through a variety of initiatives such as diversity training, mentorship programs, and employee resource groups .

Workforce Diversity Statistics

Pure Substances And Mixtures

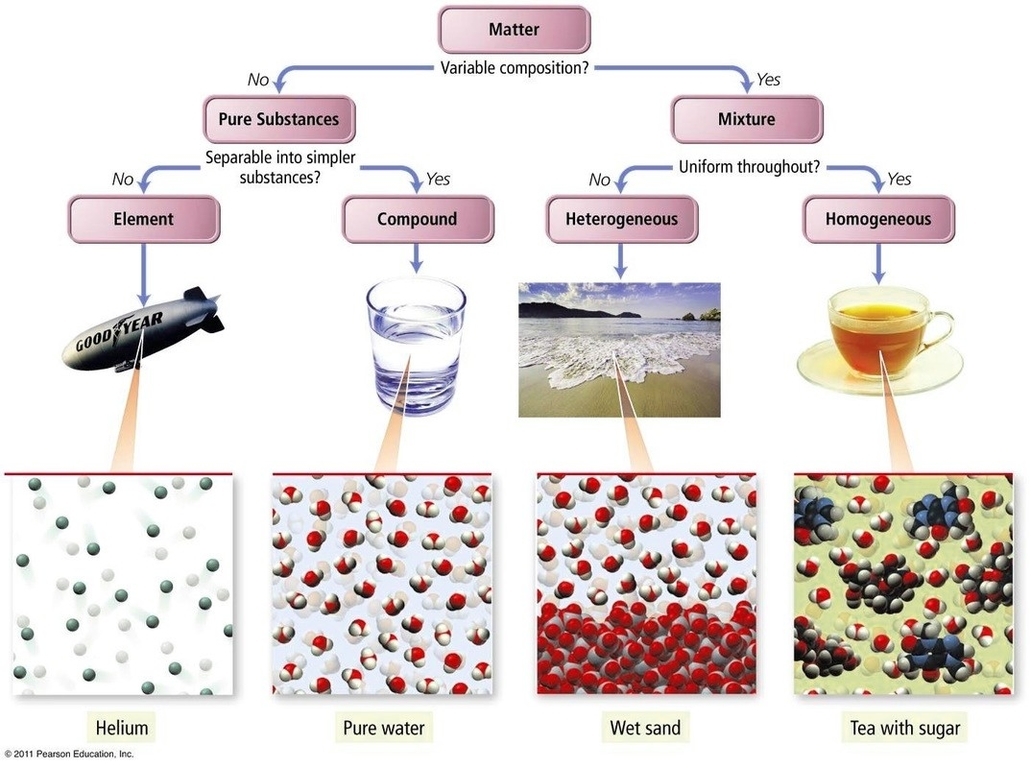
Pure substances and mixtures are two fundamental concepts in chemistry. Matter is anything that has mass and takes up space. It is classified into two broad categories: pure substances and mixtures. A pure substance is a single kind of matter that has a constant or uniform structure and cannot be broken down or transformed into new substances. Pure substances are further classified as elements and compounds. An element is a substance that consists of only one type or kind of atom. An element is a pure substance as it cannot be broken down or transformed into a new substance even by using some physical or chemical means. Elements are mostly metals, non-metals or metalloids. Compounds, on the other hand, are also pure substances when two or more elements are combined chemically in a fixed ratio. However, these substances can be broken down into separate elements by chemical methods.

Pure substances are mostly homogeneous in nature containing only one type of atom or molecule. These substances mainly have a constant or uniform composition throughout. The substances have fixed boiling and melting points. A pure substance usually participates in a chemical reaction to form predictable products. All elements are mostly pure substances. A few of them include gold, copper, oxygen, chlorine, diamond, etc. Compounds such as water, salt or crystals, baking soda amongst others are also grouped as pure substances.

A mixture is a physical combination of two or more pure substances in which each substance retains its own chemical identity. Mixtures are further divided into homogenous or heterogeneous mixture. A homogeneous mixture occasionally called a solution, is comparatively unvarying in configuration or constant. Every unit of the mixture is like every other unit. For instance, if you liquefy sugar in water and blend it really well, your concoction is essentially the same, no matter where you sample it. This mixture contains two or more chemical substances. A heterogeneous mixture is a concoction whose configuration varies from spot to spot within the sample. For example, if you put a little amount of sugar in a vessel, add some sand, and then shake the jar a couple of times, your concoction doesn’t have the same configuration all throughout the jar.

Mixtures are classified as either homogeneous or heterogeneous. A homogeneous mixture is a mixture in which the composition is uniform throughout the mixture. In other words, the mixture has the same proportion of its components throughout. Examples of homogeneous mixtures include saltwater, air, and sugar solutions. A heterogeneous mixture is a mixture in which the composition is not uniform throughout the mixture. In other words, the mixture has different proportions of its components throughout. Examples of heterogeneous mixtures include sand and water, oil and water, and soil.

In summary, pure substances are substances that are made up of only one kind of particle and have a fixed or constant structure. Pure substances are further classified as elements and compounds. A mixture is a physical combination of two or more pure substances in which each substance retains its own chemical identity. Mixtures are further divided into homogenous or heterogeneous mixture. Homogeneous mixtures are uniform throughout the mixture, while heterogeneous mixtures are not uniform throughout the mixture..

Pure Substances And Mixtures

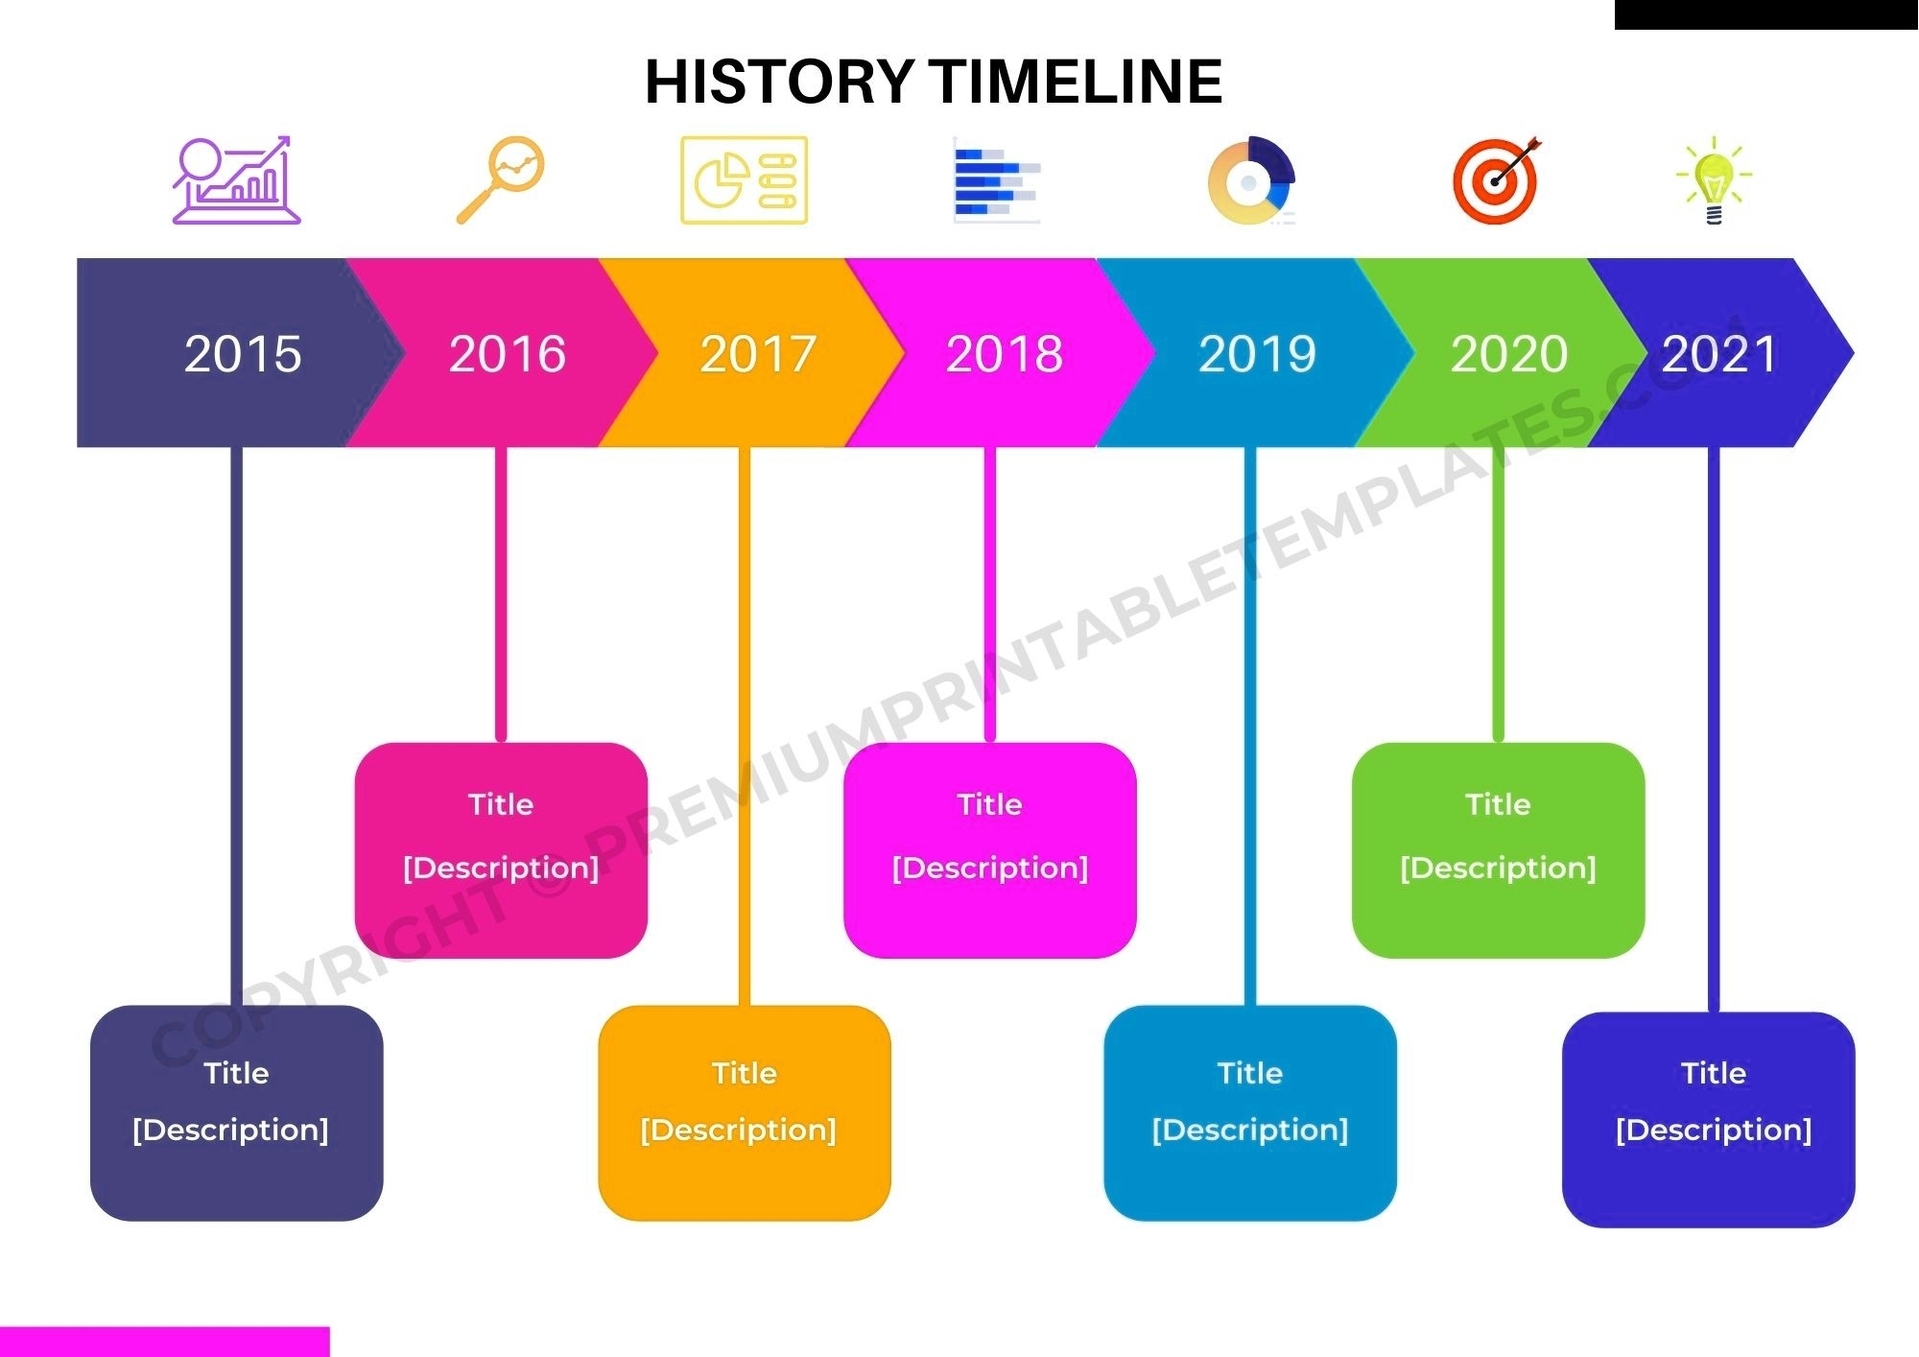
History Timeline

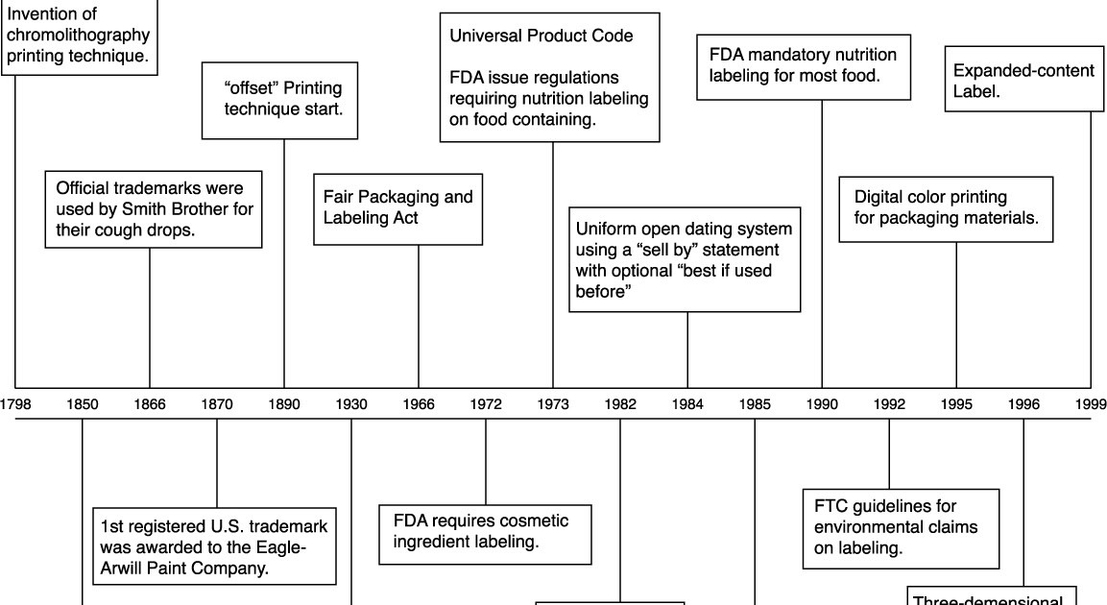
A history timeline is a graphical representation of the chronological sequence of events that have occurred in the past. It can be used to visualize the changes and developments of a specific topic, such as a country, a culture, a civilization, or a field of study, over a long period of time. A history timeline can help us understand the causes and effects of historical events, as well as the similarities and differences between different periods and regions.

There are many ways to create a history timeline, depending on the purpose and scope of the topic. Some common elements of a history timeline are:

– A horizontal or vertical line that represents the flow of time, usually from left to right or from top to bottom.
– A scale or a legend that indicates the units of time, such as years, centuries, or millennia.
– A series of markers or labels that show the dates and names of the events, along with brief descriptions or images.
– A color scheme or a theme that distinguishes different categories or types of events, such as wars, inventions, discoveries, or cultural movements.
– A title or a subtitle that summarizes the main topic or the focus of the timeline.
ome examples of history timelines are:

– [Timelines of world history](^1^), which detail recorded events since the creation of writing roughly 5000 years ago to the present day, divided into different eras and regions.
– [Timeline – World History Encyclopedia](^2^), which allows users to search through 12550 events from world history, filtered by search term, date range, or category.
– [List of timelines](^3^), which provides links to various timelines of specific topics, such as art, literature, science, religion, or sports.
– [BBC – History – Timelines](^4^), which features interactive timelines of British history, world wars, archaeology, and ancient civilizations.

A history timeline can be a useful tool for learning and teaching history, as it can help us organize and visualize historical information in a clear and engaging way. However, a history timeline also has some limitations, such as:

– It may not include all the relevant or important events that happened in a given period or region, due to the lack of sources, the bias of the creators, or the space constraints.
– It may not show the complexity or the diversity of historical phenomena

History Timeline

Life History Diagram 56

Life history is a term used in biology to describe the pattern of life events of an organism. It includes the timing and duration of key events such as birth, growth, reproduction, and death. Life history traits are shaped by natural selection and are influenced by environmental factors such as temperature, food availability, and predation risk.

I’m not sure what you mean by “Life History 56”. Could you please provide more context or clarify your question? I’m here to help you with any information you need. ??

Life History Diagram 56

Us Economic Challenges And President Elect Trump’s Policies

The US economy has been facing several challenges in recent years, including the COVID-19 pandemic, rising income inequality, and a growing national debt. President-elect Trump has proposed several policies to address these issues.

One of the key economic challenges facing the US is the COVID-19 pandemic. The pandemic has caused widespread economic disruption, with millions of Americans losing their jobs and businesses struggling to stay afloat. President-elect Trump has promised to prioritize economic recovery by investing in infrastructure, cutting taxes, and reducing regulations. He has also pledged to increase funding for healthcare and to provide additional support to small businesses.

Another major challenge facing the US economy is rising income inequality. Over the past few decades, the gap between the rich and poor has grown significantly, with the wealthiest Americans seeing their incomes rise much faster than those of the middle and working classes. President-elect Trump has proposed several policies to address this issue, including increasing the minimum wage, expanding access to affordable housing, and providing tax relief to middle-class families.

Finally, the US is facing a growing national debt, which currently stands at over $28 trillion. President-elect Trump has proposed several policies to address this issue, including reducing government spending, reforming entitlement programs, and increasing revenue by closing tax loopholes.

In summary, President-elect Trump has proposed several policies to address the economic challenges facing the US, including investing in infrastructure, reducing regulations, increasing funding for healthcare, expanding access to affordable housing, and reducing the national debt. However, it remains to be seen how effective these policies will be in addressing these complex issues.

Us Economic Challenges And President Elect Trump's Policies

Physical World Map Poster

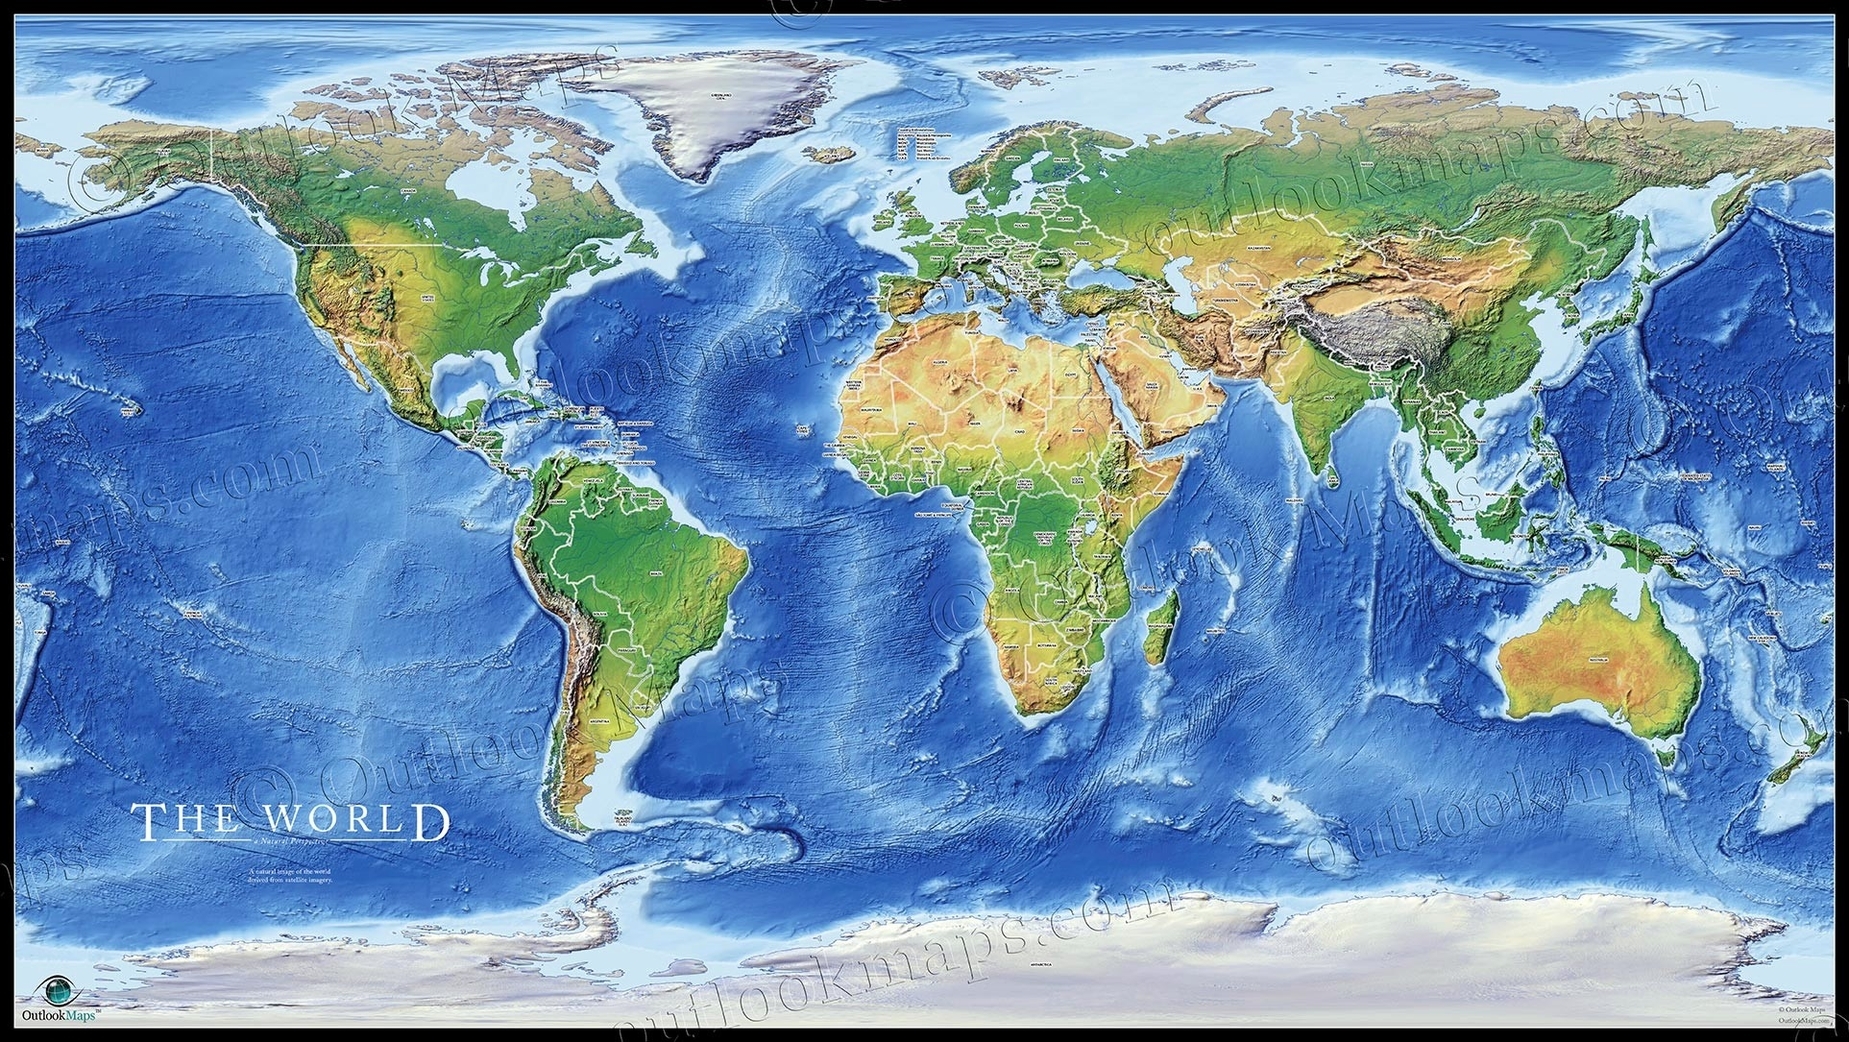
A physical world map poster is a type of map that shows the natural features of the Earth, such as mountains, rivers, oceans, deserts, forests, and climate zones. Unlike political maps, which show the boundaries and names of countries and regions, physical maps focus on the geography and topography of the world.

Physical world map posters can be used for various purposes, such as education, decoration, travel, and exploration. They can help students learn about the different continents, oceans, and landforms of the world, as well as the diversity of life and culture that exists in different regions. They can also inspire travelers to discover new places and appreciate the beauty of nature. Moreover, they can enhance the aesthetic appeal of any space, whether it is a classroom, an office, or a home.

There are many types of physical world map posters available, each with different styles, sizes, and features. Some common types are:

– Satellite image maps: These maps use satellite imagery to show the Earth’s surface in realistic colors and details. They can reveal the variations in vegetation, terrain, and human activity across the world. For example, [this map](^4^) shows the enhanced world satellite image with shaded relief.
– Relief maps: These maps use shading, colors, and contour lines to show the elevation and slope of the land. They can highlight the mountains, valleys, and plains of the world, as well as the depth and shape of the oceans. For example, [this map](^3^) shows the physical Earth map with relief.
– Climate maps: These maps use colors and symbols to show the climate zones and weather patterns of the world. They can indicate the temperature, precipitation, wind, and humidity of different regions, as well as the seasons and changes throughout the year. For example, [this map](^5^) shows the world climate map

Physical World Map Poster

Timeline Template For Powerpoint

A timeline template is a pre-designed slide or set of slides that can be used to create a timeline in PowerPoint. Timelines are a great way to visually represent information in a chronological order. They can be used to show the history of a company, the progress of a project, or the life of an individual, among other things.

There are many different types of timeline templates available for PowerPoint, ranging from simple to complex. Some templates are designed to be used for specific purposes, such as project management or event planning, while others are more general and can be used for a variety of purposes.

Microsoft Create offers a wide range of customizable timeline templates that can be used for various purposes. These templates are designed by professionals and come in different categories and colors. You can choose a template that suits your project or plan and create a captivating presentation with it .

Office Timeline is another platform that provides free PowerPoint timeline templates that can be customized for specific purposes. You can modify any of these templates manually or automatically, after you install the free timeline maker add-in for PowerPoint from Office Timeline .

PresentationGO offers a diverse collection of 46 timeline templates for PowerPoint and Google Slides that are expertly crafted to help you create visually stunning presentations that effectively showcase your project milestones, history, or plans .
lideModel provides creative timeline templates and PowerPoint timeline designs along with illustrations for delivering magnetizing PowerPoint presentations. These templates are fully editable and straightforward to adapt with a single click of your mouse .

In summary, timeline templates are a great way to visually organize information in a chronological order. There are many different types of timeline templates available for PowerPoint, ranging from simple to complex. You can choose a template that suits your project or plan and create a captivating presentation with it.

Timeline Template For Powerpoint

Geographical Features

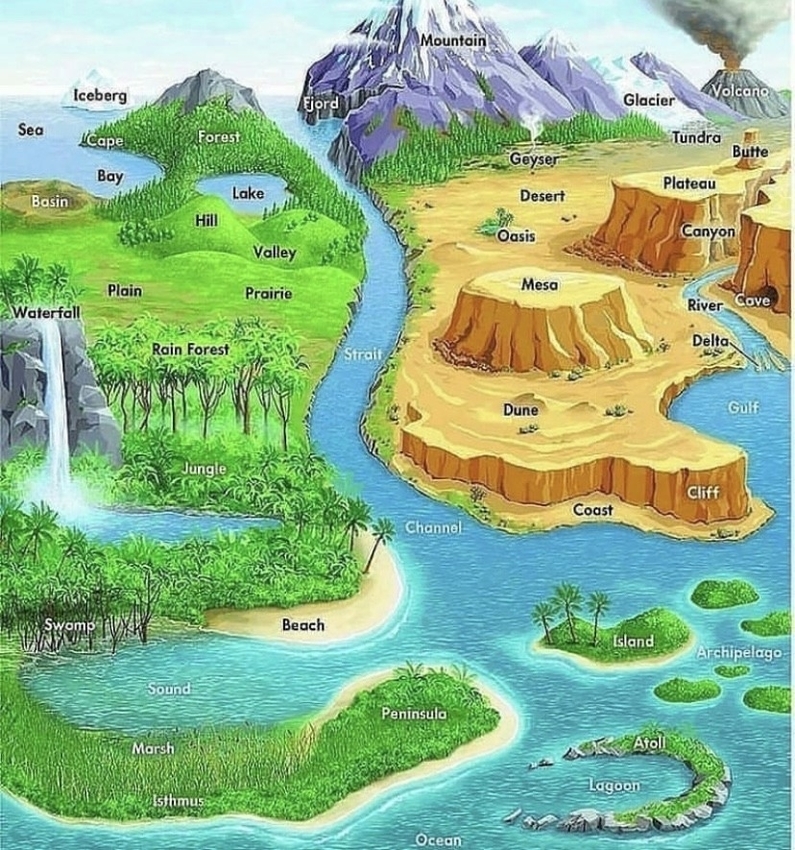
Geological features are the physical characteristics of the Earth’s surface that are created by geological forces such as erosion, deposition, and tectonic activity. These features have been shaping the Earth for millions of years. There are many types of geological features, including mountains, volcanoes, beaches, caves, springs, canyons, oceans, glaciers, rivers, and lakes .

Mountains are high features that are easily spotted on the Earth’s surface. They usually have steep sides that meet at a peak, the highest point. To classify a geological feature as a mountain, it must meet certain criteria like being at least 1,000 feet in height. There are four main types of mountains formed by movements from the tectonic plates: Folded, fault-block, volcanic, and dome mountains .

Volcanoes are geological features that are formed by the eruption of magma from the Earth’s mantle. They are characterized by a cone-shaped mountain with a crater at the top. When a volcano erupts, it releases ash, lava, and other materials that can cause damage to the surrounding area .

Beaches are geological features that are formed by the deposition of sand and other materials along the shoreline. They are typically found along the coastlines of oceans and seas. Beaches are popular tourist destinations and are known for their scenic beauty and recreational activities .

Caves are geological features that are formed by the dissolution of limestone and other soluble rocks. They are characterized by underground chambers and passages that are often decorated with stalactites and stalagmites. Caves are popular tourist destinations and are known for their unique geological formations .
prings are geological features that are formed by the emergence of groundwater from the Earth’s surface. They are characterized by a pool of water that is fed by an underground source. Springs are often used as sources of drinking water and are also popular tourist destinations .

Canyons are geological features that are formed by the erosion of rock by water and wind. They are characterized by steep walls and a narrow valley. Canyons are often found in arid regions and are popular tourist destinations .

Oceans are geological features that cover more than 70% of the Earth’s surface. They are characterized by their vastness

Geographical Features