Circular Flow Of Money

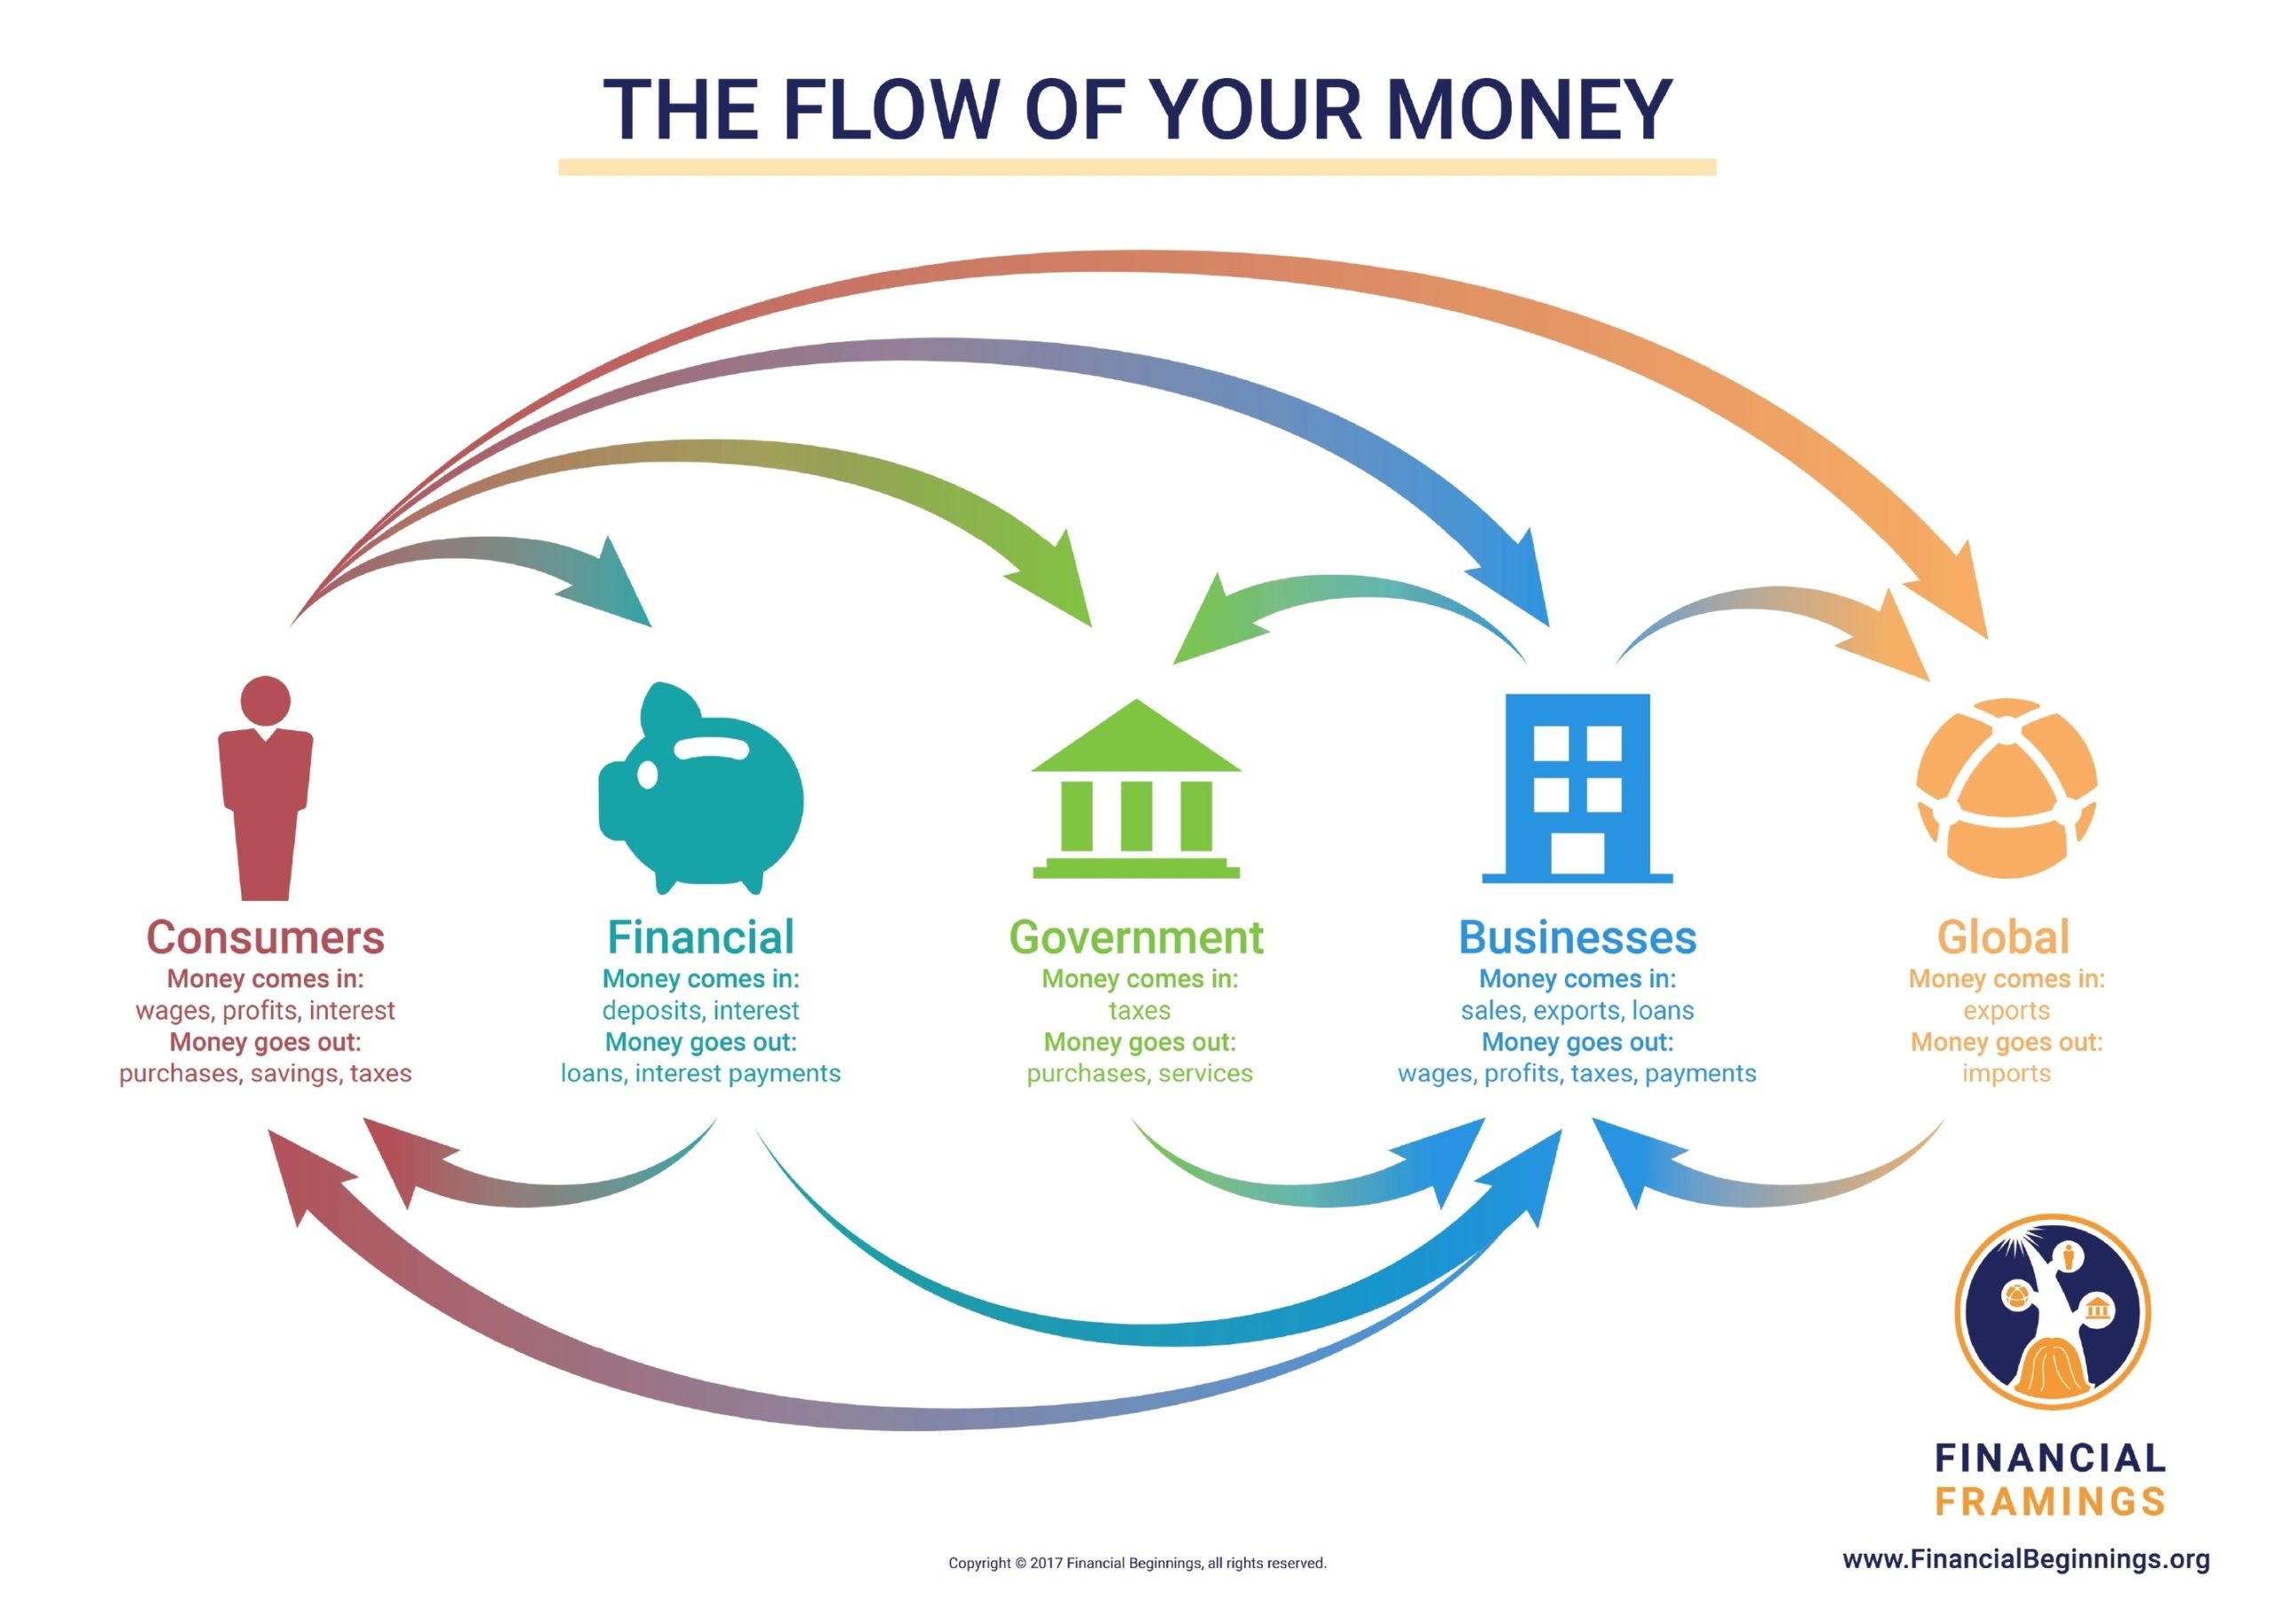
The circular flow of money is an economic model that shows how money, goods, and services move between different sectors in an economy. It also helps to measure the national income or GDP of a country. Here is a brief essay on the circular flow of money in about 1000 words:

The circular flow of money is based on the idea that money flows in cycles between different agents in an economy, such as households, businesses, government, foreign sector, and financial sector. These agents interact in two types of markets: the product market and the factor market. The product market is where goods and services are bought and sold, and the factor market is where resources for production, such as labor, capital, land, and entrepreneurship, are hired and paid.

The simplest version of the circular flow model is the two-sector model, which only includes households and businesses. In this model, households provide labor and other factors of production to businesses in exchange for income, such as wages, rent, interest, and profit. This income is then spent by households on goods and services produced by businesses. Thus, money flows from households to businesses as consumer spending, and from businesses to households as factor payments. The total value of goods and services produced by businesses equals the total income received by households, which is also the total expenditure by households. This is the basic identity of GDP: GDP = C + I, where C is consumption and I is investment.

However, the two-sector model is too simplistic to capture the reality of a modern economy. Therefore, more sectors are added to the model to make it more realistic and comprehensive. The three-sector model introduces the government sector, which collects taxes from households and businesses, and spends money on public goods and services, such as roads, schools, health care, and defense. The government sector can affect the circular flow of money by creating a budget surplus or deficit. A budget surplus occurs when the government collects more taxes than it spends, and a budget deficit occurs when the government spends more than it collects. A budget

Circular Flow Of Money

Chemistry Experiment Illustration

Chemistry Experiment Illustration is a visual representation of a chemistry experiment. It can be a diagram, a graph, or a chart that shows the setup of the experiment, the chemical reactions taking place, and the results obtained. These illustrations are used to help students and researchers understand the concepts and principles of chemistry experiments.

There are many websites that offer free and paid Chemistry Experiment Illustrations. One such website is Chemix . It is an online editor that allows students and teachers to draw diagrams of common laboratory equipment and lab setup of science experiments. It is simple and intuitive, and it is designed to help students and pupils draw diagrams easily.

Another website that offers Chemistry Experiment Illustrations is iStock . It has a collection of over 62,000 illustrations and vector graphics that are available royalty-free. You can browse through the collection or search for specific illustrations using keywords such as “chemistry experiment glass” or “kids chemistry experiment”.

Dreamstime is another website that offers a wide range of chemical laboratory experiment illustrations and vectors. It has over 96,000 illustrations and vectors that are available royalty-free. You can download these illustrations and vectors for free or at a low cost.

Finally, Pixabay is a website that offers over 271 free Chemistry Experiment Illustrations. You can download these illustrations for free and use them for your projects.

Chemistry Experiment Illustration

Patristic Writers Chart

Patristic writers are early Christian writers who are designated Church Fathers. The period of the Church Fathers, commonly called the Patristic era, is generally considered to run from the end of New Testament times or end of the Apostolic Age (c. AD 100) to either AD 451 (the date of the Council of Chalcedon) or to the Second Council of Nicaea in 787 . Patristic literature is generally identified today with the entire Christian literature of the early Christian centuries, irrespective of its orthodoxy or the reverse . The works of the Apostolic Fathers contain the earliest patristic literature. By the mid-2nd century, Christians wrote to justify their faith to the Roman government and to refute Gnosticism .
ignificant patristic authors include Justin Martyr, Origen, Tertullian, Eusebius of Caesarea, Athanasius, Basil the Great, St. Gregory of Nyssa, Gregory of Nazianzus, John Chrysostom, Ambrose, Ephraem Syrus, St. Jerome, Theodore of Mopsuestia, St. Cyril of Alexandria, St. Maximus the Confessor, and Pope Gregory I . These theologians focused on Christianity’s relationship with Judaism, the establishment of the New Testament canon, apologetics (the ‘defense’ or ‘explanation’ of Christianity), and doctrinal discussions that sought to achieve consistency of faith, in particular within the Christianized Roman Empire .

Patristic literature is a body of literature that comprises those works, excluding the New Testament, written by Christians before the 8th century. Most patristic literature is in Greek or Latin, but much survives in Syriac and other Middle Eastern languages . The undoubtedly orthodox Fathers themselves cannot be properly understood in isolation from their doctrinally unorthodox contemporaries. Early Christian literature exists, and deserves to be studied, as a whole and that much will be lost if any sector is neglected because of supposed doctrinal shortcomings .

Patristic Writers Chart

Venn Diagram Worksheet

A Venn diagram is a graphical representation of the relationships between sets. It is named after John Venn, an English logician and philosopher who introduced the concept in 1880. Venn diagrams are used to illustrate the logical relationships between two or more sets of items. They are often used in mathematics, statistics, computer science, and other fields to help visualize complex data.

Venn diagrams consist of overlapping circles or other shapes that represent sets. The items in each set are represented by points within the circle or shape. The overlapping areas between the circles or shapes represent the items that are common to both sets. The non-overlapping areas represent the items that are unique to each set.

Venn diagrams can be used to illustrate a variety of logical relationships between sets. For example, they can be used to show the intersection of two or more sets, the union of two or more sets, the difference between two sets, or the complement of a set.

There are many different types of Venn diagrams, including two-set diagrams, three-set diagrams, and more. Two-set diagrams are the most common type and are often used to illustrate the relationship between two sets of items. Three-set diagrams are used to illustrate the relationship between three sets of items.

Venn diagrams can be used in a variety of ways. For example, they can be used to help students understand the relationships between different sets of data. They can also be used to help researchers visualize complex data sets and identify patterns and relationships between different variables.

Venn diagrams can be created using a variety of tools, including software programs, online tools, and paper and pencil. There are many different types of Venn diagram worksheets available online that can be used to help students practice creating and interpreting Venn diagrams. These worksheets often include a variety of different types of problems, such as finding the intersection of two sets, finding the union of two sets, or finding the difference between two sets.

In conclusion, Venn diagrams are a powerful tool for visualizing the relationships between sets of data. They are used in a variety of fields to help researchers and students

Venn Diagram Worksheet

Statistics Infographic

Statistics Infoic is not a term that I am familiar with. However, I can provide you with some information on statistics and the Canadian statistical agency, Statistics Canada.
tatistics is a branch of mathematics that deals with the collection, analysis, interpretation, presentation, and organization of data. It is used to gain insights into complex phenomena and to make informed decisions. Statistics is used in a wide range of fields, including science, engineering, medicine, business, and social sciences.
tatistics Canada is the national statistical agency of Canada. It is responsible for collecting, analyzing, and publishing statistical information about Canada’s economy, society, and environment. The agency provides Canadians with the key information they need to function effectively as citizens and decision-makers. Some of the topics covered by Statistics Canada include population and demographics, health, education, crime, the economy, and the environment.
tatistics Canada collects data from a wide range of sources, including surveys, administrative records, and censuses. The agency uses this data to produce a wide range of statistical products, including tables, charts, and reports. These products are available to the public through the agency’s website.

In addition to its core statistical work, Statistics Canada also provides a range of other services. For example, the agency provides data analysis and consulting services to other government departments, as well as to private sector clients. It also provides training and support to other organizations that use statistical methods.

Statistics Infographic

Economic Growth Definition

Economic growth is a term used to describe the increase in the production of goods and services in an economy over a period of time. It is commonly measured in terms of gross domestic product (GDP) or gross national product (GNP) . Economic growth can be measured in nominal or real terms, with the latter adjusted for inflation .

Economic growth is a result of various factors such as increases in capital goods, labor force, technology, and human capital . Capital goods refer to the physical assets used in the production of goods and services, such as machinery, equipment, and buildings . Labor force refers to the number of people who are employed or seeking employment in an economy . Technology refers to the application of scientific knowledge for practical purposes, such as the development of new products or processes . Human capital refers to the knowledge, skills, and abilities of the workforce .

Economic growth is important because it can lead to an increase in the standard of living of the people in an economy . When an economy grows, there is an increase in the production of goods and services, which can lead to an increase in employment opportunities and wages . This can result in an increase in consumer spending, which can further stimulate economic growth .

However, economic growth can also have negative consequences. For example, if the rewards of economic growth go only to an elite group, then it is unlikely that the growth will be sustainable . Additionally, economic growth can lead to environmental degradation if it is not managed properly .

In conclusion, economic growth is an increase in the production of goods and services in an economy over a period of time. It is measured in terms of gross domestic product (GDP) or gross national product (GNP). Economic growth is a result of various factors such as increases in capital goods, labor force, technology, and human capital. Economic growth is important because it can lead to an increase in the standard of living of the people in an economy. However, economic growth can also have negative consequences if it is not managed properly..

Economic Growth Definition

Economic Recovery Chart

Economic recovery is the process of reallocating resources and workers from failed businesses and investments to new jobs and uses after a recession. It is the business cycle stage following a recession that is characterized by a sustained period of improving business activity. Normally, during an economic recovery, gross domestic product (GDP) grows, incomes rise, and unemployment falls as the economy rebounds . During an economic recovery, the economy undergoes a process of adaptation and adjustment to new conditions, including the factors that triggered the recession in the first place and the new policies and rules implemented by governments and central banks in response to the recession . The labor, capital goods, and other productive resources that were tied up in businesses that failed and went under during the recession are re-employed in new activities as unemployed workers find new jobs and failed firms are bought up or divided up by others . Recovery is an economy healing itself from the damage done, and it sets the stage for a new expansion .

The process of economic recovery is not always smooth and can be influenced by various factors. Leading indicators such as the stock market, retail sales, and business startups often rise ahead of an economic recovery . Government policies can sometimes help or interfere with the economic recovery process. During an economic recovery, central banks may enact monetary policies aimed at increasing the money supply and encouraging lending . However, the effectiveness of these policies can be limited by factors such as high levels of debt, low consumer confidence, and weak demand .

The COVID-19 pandemic has had a significant impact on the global economy, leading to a recession in many countries. The economic recovery from the pandemic has been uneven across sectors and demographic groups, and it is expected to come in waves . The global supply disruptions and related price increases we are experiencing reflect the broader economic forces triggered by the shutdown and reopening of the economy . The recovery from the pandemic is unique and complex, as we have never shut down and reopened an economy before .

In conclusion, economic recovery is a crucial stage in the business cycle that follows a recession. It is characterized by a sustained period of improving business activity, and it sets the stage for a new expansion. The process of economic recovery can be influenced by various factors, including government policies, consumer confidence,

Economic Recovery Chart

World Population 3

World population diagram above with explanations.

World Population 3

Gorge In Geography

A gorge is a deep channel created by millions of years of erosion by a river and other forms of weathering . The term “gorge” was derived from the French word meaning “neck” or “throat” . Gorges are typically formed in areas composed of limestone rock . They are more common in dry areas, because erosion is common in arid places . Gorges can be formed due to water erosion, weathering, geologic uplift, or the movement and melting of glaciers . Generally, they are located between mountains, hills or near-desert plateaus, at the point where a river cuts a channel into the land .

The most well-known gorge in the world is the Grand Canyon, which is located in US state of Arizona and was formed by the Colorado River . It is 6,000 feet deep, 277 miles long, and has a width of 15 miles at its widest point . Other notable gorges include the Victoria Falls Gorge, Canyon Lake Gorge, Yarlung Zangbo Grand Canyon, Three Gorges, Olduvai Gorge, Talari Gorges, Macocha Gorge, Gorge de Verdun, New River Gorge, Columbia River Gorge, and Gorges of Finger Lakes .

Gorges can be formed when an earthquake causes geologic uplift . This uplift causes some parts of Earth’s surface to be more elevated than the surrounding area. When rivers flow across these uplifted areas, waterfalls are formed. Meanwhile, the erosion of softer layers of rock occurs, leading to the collapse of a river bed, which forms a gorge . For example, the Macocha Gorge in the Czech Republic was formed due to the erosion of the Punkva River, which resulted in the collapse of an underground cave .

There are three primary types of gorges: slot canyons, box canyons, and submarine canyons . A slot canyon is a narrow gorge with smooth walls, box canyons are open on only one side, while submarine canyons are formed due to landslides and turbidity currents, rather than weathering or erosion .

Gorges can have economic, recreational, and geological benefits . For example, the rivers that form and flow through a gorge can be harnessed through hydroelectric dams for the production of electricity . Gorges can also form waterways that can be navigated by freight ships. Additionally, gorges and rivers can create opportunities for recreational activities like wind sailing, whitewater rafting, and hiking . Many geological discoveries have occurred due to the creation of gorges, as these canyons expose rocks that existed thousands of years ago .

Gorge In Geography

World Population Growth Graph

World population growth is the change in the number of people living on Earth over time. It is influenced by factors such as birth rates, death rates, migration, and environmental changes. Here is a brief overview of world population growth in about 1000 words:

The world population has increased rapidly in recent centuries, reaching over 8 billion people in 2023. However, this growth is not evenly distributed across regions, countries, or demographic groups. Some areas of the world are experiencing faster population growth than others, and some are even facing population decline. Moreover, the age structure, sex ratio, and urbanization of the population vary widely across the world, with implications for social and economic development.

The main drivers of population growth are fertility and mortality. Fertility is the average number of children a woman has in her lifetime, and it depends on factors such as culture, education, health, and family planning. Mortality is the rate at which people die, and it depends on factors such as disease, violence, nutrition, and medical care. Migration is another factor that affects population growth, as people move from one place to another for various reasons, such as work, education, or safety.

The global fertility rate has declined significantly over the past decades, from about 5 children per woman in 1950 to about 2.4 in 2023. This is mainly due to the improvement of women’s education, health, and empowerment, as well as the availability and use of contraceptives. However, there are still large differences in fertility levels across regions and countries, ranging from 1.1 in South Korea to 6.9 in Niger. The global mortality rate has also declined over the past decades, from about 19 deaths per 1000 people in 1950 to about 7.5 in 2023. This is mainly due to the reduction of infectious diseases, child mortality, and maternal mortality, as well as the advancement of medical technology and public health. However, there are still large differences in mortality levels across

World Population Growth Graph