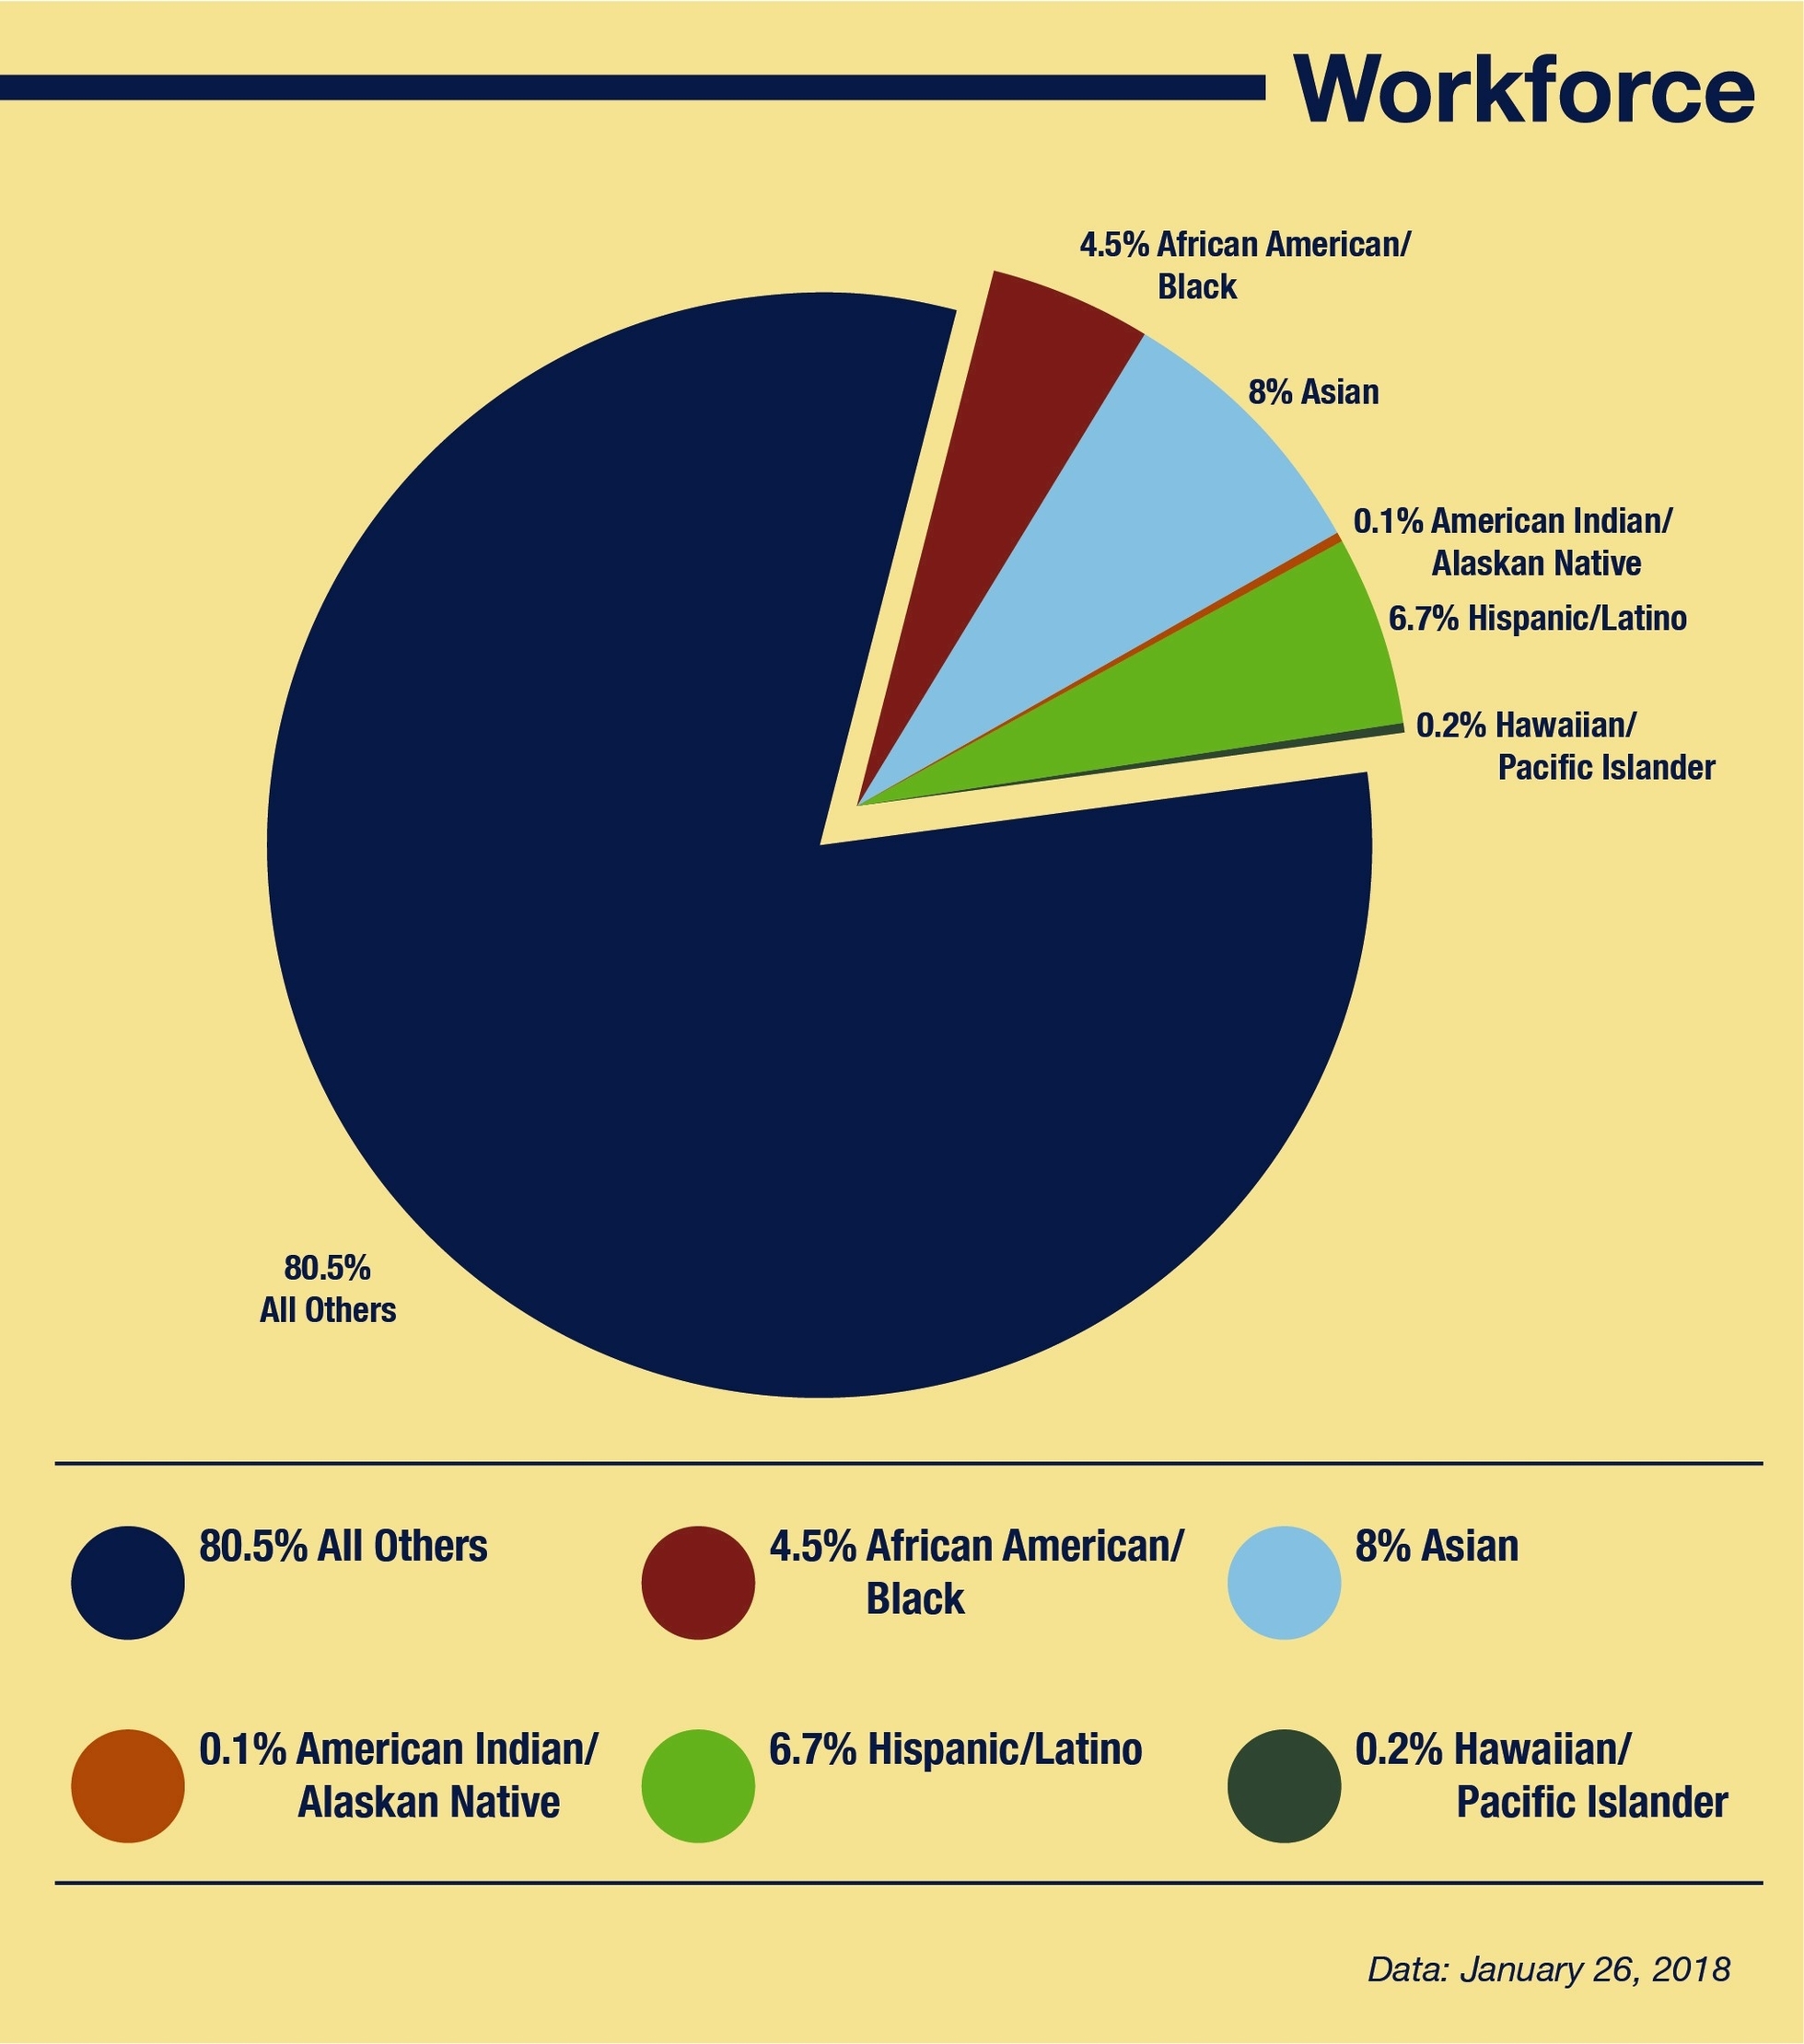
Workforce diversity statistics are a measure of the representation of different groups of people in the workforce. These statistics can help organizations understand how well they are doing in terms of creating a diverse and inclusive workplace. In Canada, the Treasury Board of Canada Secretariat provides static and interactive statistics on employment equity populations in Canadas public service (core public administration) and information related to diversity as part of the Public Service Employee Survey . The table provides representation data for the four main employment equity designated groups (women, Indigenous peoples, members of visible minorities and persons with disabilities), as well as the overall workforce availability estimates as a benchmark for each of the corresponding groups .
In the United States, the Bureau of Labor Statistics (BLS) provides data on the diversity of the labor force. As of 2022, the U.S. labor force is 77% white, 12.6% Black or African American, 18.5% Hispanic or Latino, and 6.7% Asian . Women make up 46.8% of the U.S. civilian labor force .
Diversity in the workplace has been shown to have many benefits. For example, companies with diverse management have been shown to increase revenue by 19% . Diverse companies enjoy 2.5 times higher cash flow per employee . Gender-diverse companies and executive teams outperform less gender-diverse peers .
It is important to note that diversity statistics are not just about numbers. They are also about creating an inclusive culture where everyone feels valued and respected. This can be achieved through a variety of initiatives such as diversity training, mentorship programs, and employee resource groups .
