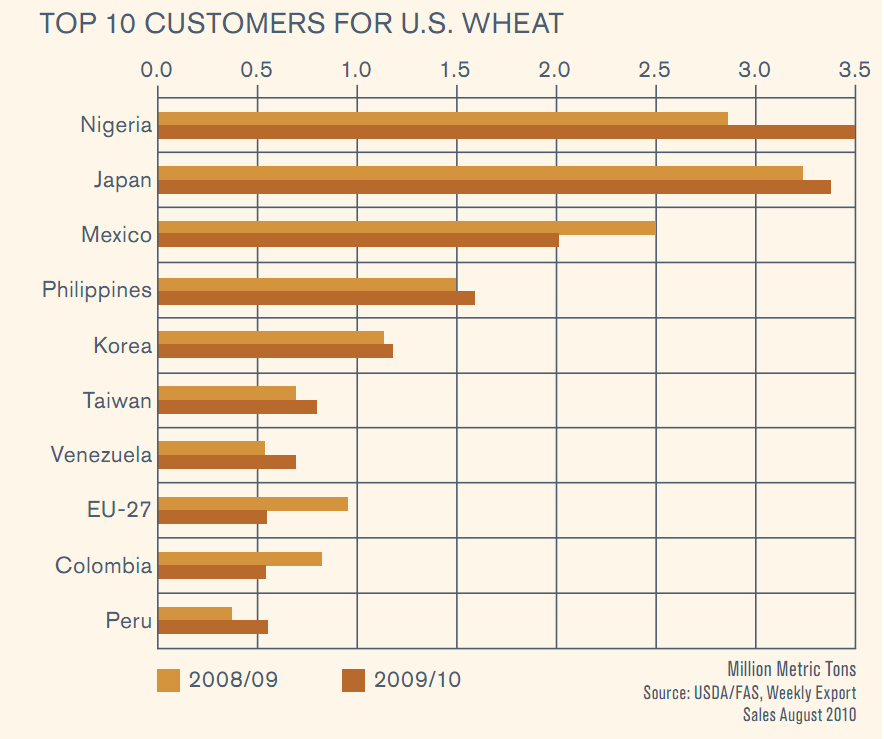
Top 10 Customers for U.S. wheat in 2008/9-2009/10: Nigeria, Japan, Mexico, Philippines, Korea, others. Source: http://www.uswheat.org/reports/annualReport https://ygraph.com/chart/414
Top 10 Customers for U.S. wheat in 2008/

Charts, Graphs and Diagrams
Top 10 Customers for U.S. wheat in 2008/9-2009/10: Nigeria, Japan, Mexico, Philippines, Korea, others. Source: http://www.uswheat.org/reports/annualReport https://ygraph.com/chart/414

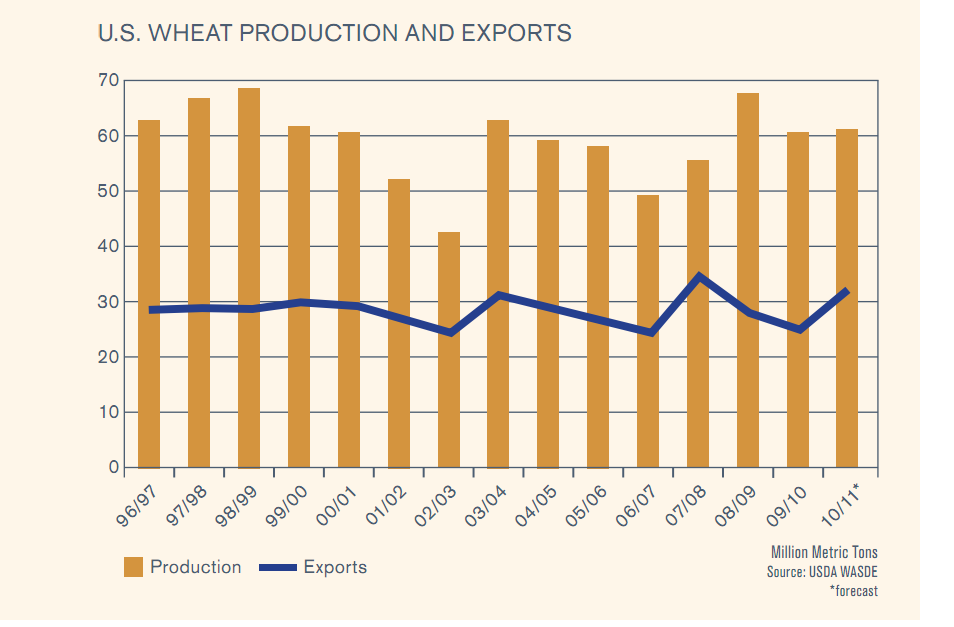
USA Wheat production. 1996-2011. Source: http://www.uswheat.org/reports/annualReport/doc/00FB842AE7FAA568852577BB004964B7/$File/USW%202009-2010%20Annual%20Report.pdf?OpenElement# https://ygraph.com/chart/413

World Wheat Supply and Demand Situation. Wheat Production, consumption and ending stocks. Source: http://www.uswheat.org https://ygraph.com/chart/412

World Demographics: Africa’s pyramid, Europe’s Bulge. Africa world’s fastest growing continent https://ygraph.com/chart/411

World Democracy, Autocracy, Anocracy graph 1950-2006 by type and by Sam Diener. Source: http://www.peaceworkmagazine.org/editors-desk-25 #democracy #autocracy https://ygraph.com/chart/410

Map of USA showing state names. Source: http://en.wikipedia.org/wiki/File:Map_of_USA_with_state_names_2.svg https://ygraph.com/chart/409

Number and percent foreign born in the US population. 1850-2009. Source: http://izismile.com/2011/04/02/fascinating_us_census_maps_and_graphs_25_pics.html https://ygraph.com/chart/473

USA National Population by Race 2010. 2010 Census Results. Source: http://izismile.com/2011/04/02/fascinating_us_census_maps_and_graphs_25_pics.html https://ygraph.com/chart/472

The Average Income Per Person per State, USA. 2010. Change from 2000-2010. Top 3: Connecticut, Massachusetts, New Jersey. Source: http://izismile.com/2011/04/02/fascinating_us_census_maps_and_graphs_25_pics.html https://ygraph.com/chart/471

USA Shrinking Cities. Biggest population decreases since 2000 among major cities. New Orleans, Detroit, Cleveland. The Rise and Fall of Detroit’s Population. Source: http://izismile.com/2011/04/02/fascinating_us_census_maps_and_graphs_25_pics.html https://ygraph.com/chart/470
