Skip to content
cropped logo

Ygraph

Your Graphs, Charts and Diagrams

Menu

Primary menu

  • Submit Diagram
  • Science
  • Business
  • Economy
    • GDP
    • Demographics
  • Explained
    • Signs
    • Maps
  • Health
    • Anatomy
  • Sizes

USA Wheat production. 1996-2011. Source:

USA Wheat production. 1996-2011. Source: http://www.uswheat.org/reports/annualReport/doc/00FB842AE7FAA568852577BB004964B7/$File/USW%202009-2010%20Annual%20Report.pdf?OpenElement# https://ygraph.com/chart/413

USA Wheat production. 1996-2011. Source:
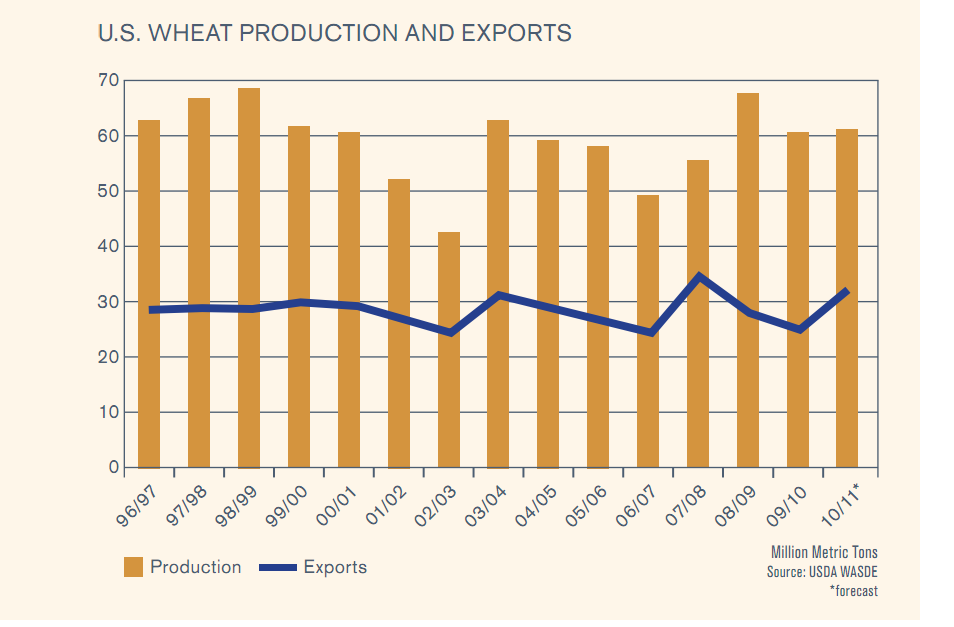
USA Wheat production. 1996-2011. Source: image

Post navigation

← Previous Previous post: Racial homogeneity as a strong predictor
Next → Next post: Standard and Poor 500 Index from 1871 to
  • Chart Diagram
  • Meme Gif
  • Logo Sign
  • Business Diagrams
  • Human Anatomy
  • Graph Diagram
  • Business Diagrams
  • Economy GDP
  • Twitter
Copyright © 2023 Ygraph. All Rights Reserved.
Theme: Catch Box by Catch Themes
Scroll Up