Percent Change in Population in USA, 2000-2010 Source: http://izismile.com/2011/04/02/fascinating_us_census_maps_and_graphs_25_pics.html https://ygraph.com/chart/469
Percent Change in Population in USA, 200

Charts, Graphs and Diagrams
Percent Change in Population in USA, 2000-2010 Source: http://izismile.com/2011/04/02/fascinating_us_census_maps_and_graphs_25_pics.html https://ygraph.com/chart/469

Growth in Hispanic Population Share in USA, 2000-2010. Source: http://izismile.com/2011/04/02/fascinating_us_census_maps_and_graphs_25_pics.html https://ygraph.com/chart/468

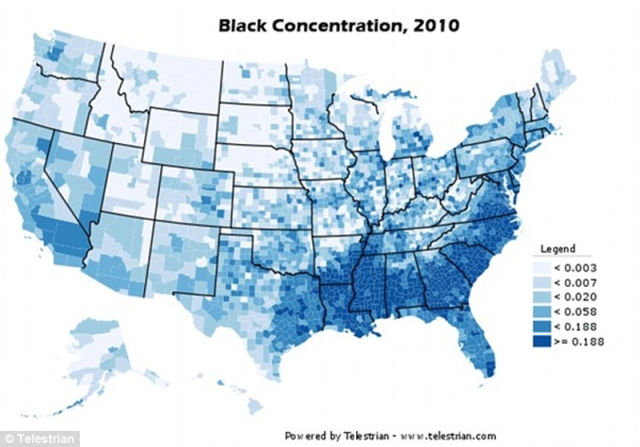
Black Concentration, Population in USA. 2010 Source. http://izismile.com/2011/04/02/fascinating_us_census_maps_and_graphs_25_pics.html https://ygraph.com/chart/467

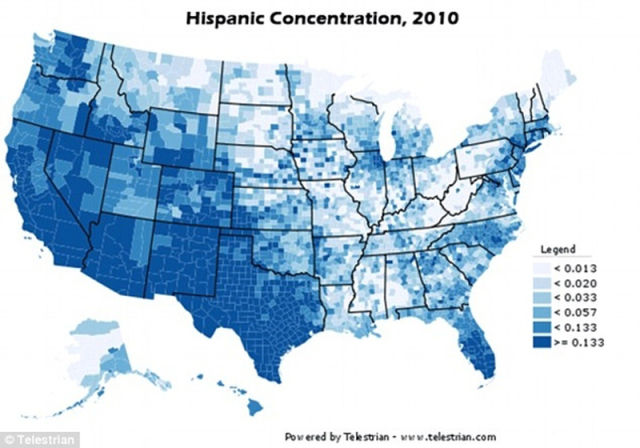
Hispanic Concentration in USA, 2010. Source: http://izismile.com/2011/04/02/fascinating_us_census_maps_and_graphs_25_pics.html https://ygraph.com/chart/465

Comparisson of US and European minimum wages by country. Minimum wage per hour by Eurostat. Source: http://thesocietypages.org/socimages/2011/04/26/the-tipping-point-for-support-of-same-sex-marriage/ https://ygraph.com/chart/464

Most Harmful Drugs, to User and Others. Drug harm in the UK, 2010. Alcohol, heroin, cocaine. https://ygraph.com/chart/463

Same Sex Marriage: Public Opinion: Polls 1988-2011. http://thesocietypages.org/socimages/2011/04/26/the-tipping-point-for-support-of-same-sex-marriage/ https://ygraph.com/chart/461

Racial homogeneity as a strong predictor of welfare generosity. Social Spending (percent of GDP) and Racial Fractionalization. Source: http://montclairsoci.blogspot.com/2011/02/those-people.html https://ygraph.com/chart/459

Market data for natural gas, 1990 – 2011. Difference in price between oil and natural gas. World oil consumption. Source: http://thesocietypages.org/graphicsociology/2011/02/28/fracking-natural-gas/ https://ygraph.com/chart/457

Emerging Automobile (Car) market growth graph in comparisson to mature markets. USA, Western Europe, Japan vs. BRIC (Brazil, Russia, India, China), 2008 Source: http://in.reuters.com/article/2008/09/04/autos-emerging-idINT16557320080904 https://ygraph.com/chart/455
