Skip to content
cropped logo

Ygraph

Charts, Graphs and Diagrams

Menu

Primary menu

  • Submit Diagram
  • Science
  • Business
  • Economy
    • GDP
  • Demographics
  • Explained
    • Signs
    • Maps
  • Health
  • Anatomy
  • Sizes

Contribution to Global Carbon Monoxide E

Contribution to Global Carbon Monoxide Emissions 2000 by country https://ygraph.com/chart/427

Contribution to Global Carbon Monoxide E

Posted in chart, science

Stock market: the Broker / Dealer Index

Stock market: the Broker / Dealer Index which reflects the action within the financial sector. Source: http://www.sunshineprofits.com/commentary/15-mar-0 https://ygraph.com/chart/424

Stock market: the Broker / Dealer Index

Posted in chart, Economy

Oil price chart 2002 – 2011, monthly: So

Oil price chart 2002 – 2011, monthly: Source http://www.fxtimes.com/fundamental-updates/oil-falls-to-85-a-barrel-as-kuwaiti-official-hints-at-opec-raising-production/ https://ygraph.com/chart/423

Oil price chart 2002 – 2011, monthly: So

Posted in chart, Economy

World OIl Reserves by Country. Who has t

World OIl Reserves by Country. Who has the oil? Source: http://presscore.ca/nbg/index.php?entry=entry080522-071515 https://ygraph.com/chart/422
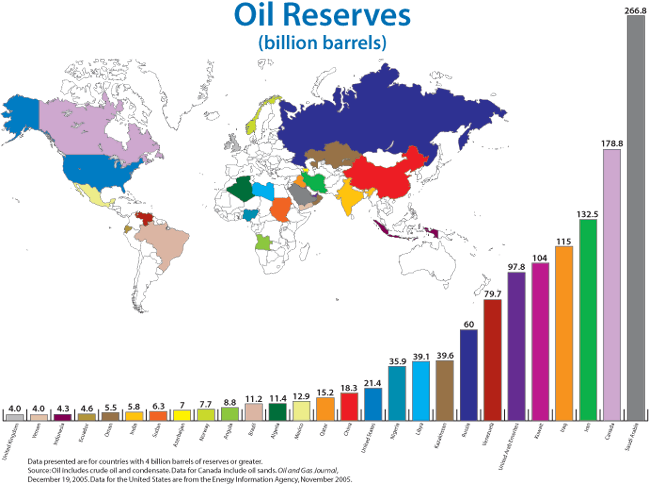
World OIl Reserves by Country. Who has t

Posted in chart, Economy

Peak Oil: Oil producing countries past p

Peak Oil: Oil producing countries past peak. Source: http://gasprices-usa.com/ https://ygraph.com/chart/421

Peak Oil: Oil producing countries past p

Posted in chart, Economy

USA Economy Growith 2004-2008

USA Economy Growith 2004-2008 https://ygraph.com/chart/420

USA Economy Growith 2004-2008

Posted in chart, Economy

USA Economy Real Household Wealth in Equ

USA Economy Real Household Wealth in Equities and Homes 1952-2009. Source: http://www.marketoracle.co.uk/Article4428.html https://ygraph.com/chart/419

USA Economy Real Household Wealth in Equ

Posted in chart, Economy

Standard and Poor 500 Index from 1871 to

Standard and Poor 500 Index from 1871 to 2008 shows why it pays to stay invested despite wars, depression and political crises. Stock market always grows in the long run. Source: http://moneymorning.com/2008/08/07/stock-market-chart/ https://ygraph.com/chart/418

Standard and Poor 500 Index from 1871 to

Posted in chart, Economy

Gallup’s USA Economic Confidence Index a

Gallup’s USA Economic Confidence Index and 2010-2011 by week. Source: http://www.gallup.com/poll/122840/Gallup-Daily-Economic-Indexes.aspx https://ygraph.com/chart/417

Gallup’s USA Economic Confidence Index a

Posted in chart, Economy

Gold adjusted to inflation 1880-2010. So

Gold adjusted to inflation 1880-2010. Source: http://thedraconian.com/2011/01/06/predictions-for-2011-part-one/ https://ygraph.com/chart/416

Gold adjusted to inflation 1880-2010. So

Posted in chart, Economy

Post navigation

← Older posts
Newer posts →

Primary Sidebar Widget Area

Top Diagrams

Latest Posts

  • How to Stop Time from Flying
  • Political Party Roles
  • Cell Structure
  • Costa Rica Population
  • Rog
  • Geography Termsgeography Vocabulary
  • Economics Diagrameconomic Flow Diagram 6
  • Map Of Philosophy Of History
  • Macroeconomics Circular Flow Diagram
  • Tajikistan Population
  • Free Body Diagram
  • Fjord Formation
  • Guinea Bissau Births per woman
  • Kazakhstan Population
  • Political Process Definition
  • Horseshoe Political Theory

Top Tags

  • sizes (35)
  • size chart (35)
  • size conversion (35)
  • economy chart (33)
  • economy graph (33)
  • economy diagram (33)
  • cell (29)
  • cell diagram (29)
  • cell illustration (29)
  • window (24)
  • window diagram (24)
  • types of windows (24)
  • origami (16)
  • origami steps (16)
  • how to make origami (16)
  • biology (16)
  • biology diagram (16)
  • yoga (8)
  • yoga routine (8)
  • yoga poses (8)

Categories

  • anatomy
  • Business
  • chart
  • Demographics
  • Eco
  • Ecom
  • Economy
  • Explained
  • GDP
  • Health
  • Maps
  • notice
  • science
  • Signs
  • Sizes
  • Uncategorized

Useful Resources

  • Chart Diagram
  • Meme Gif
  • Logo Sign
  • Human Anatomy
  • Graph Diagram
  • Economy GDP
  • Twitter
Copyright © 2025 Ygraph. All Rights Reserved.
Theme: Catch Box by Catch Themes
Scroll Up
WP Twitter Auto Publish Powered By : XYZScripts.com