Skip to content
cropped logo

Ygraph

Charts, Graphs and Diagrams

Menu

Primary menu

  • Submit Diagram
  • Science
  • Business
  • Economy
    • GDP
  • Demographics
  • Explained
    • Signs
    • Maps
  • Health
  • Anatomy
  • Sizes

Human Physiology Chart

Human Physiology Chart

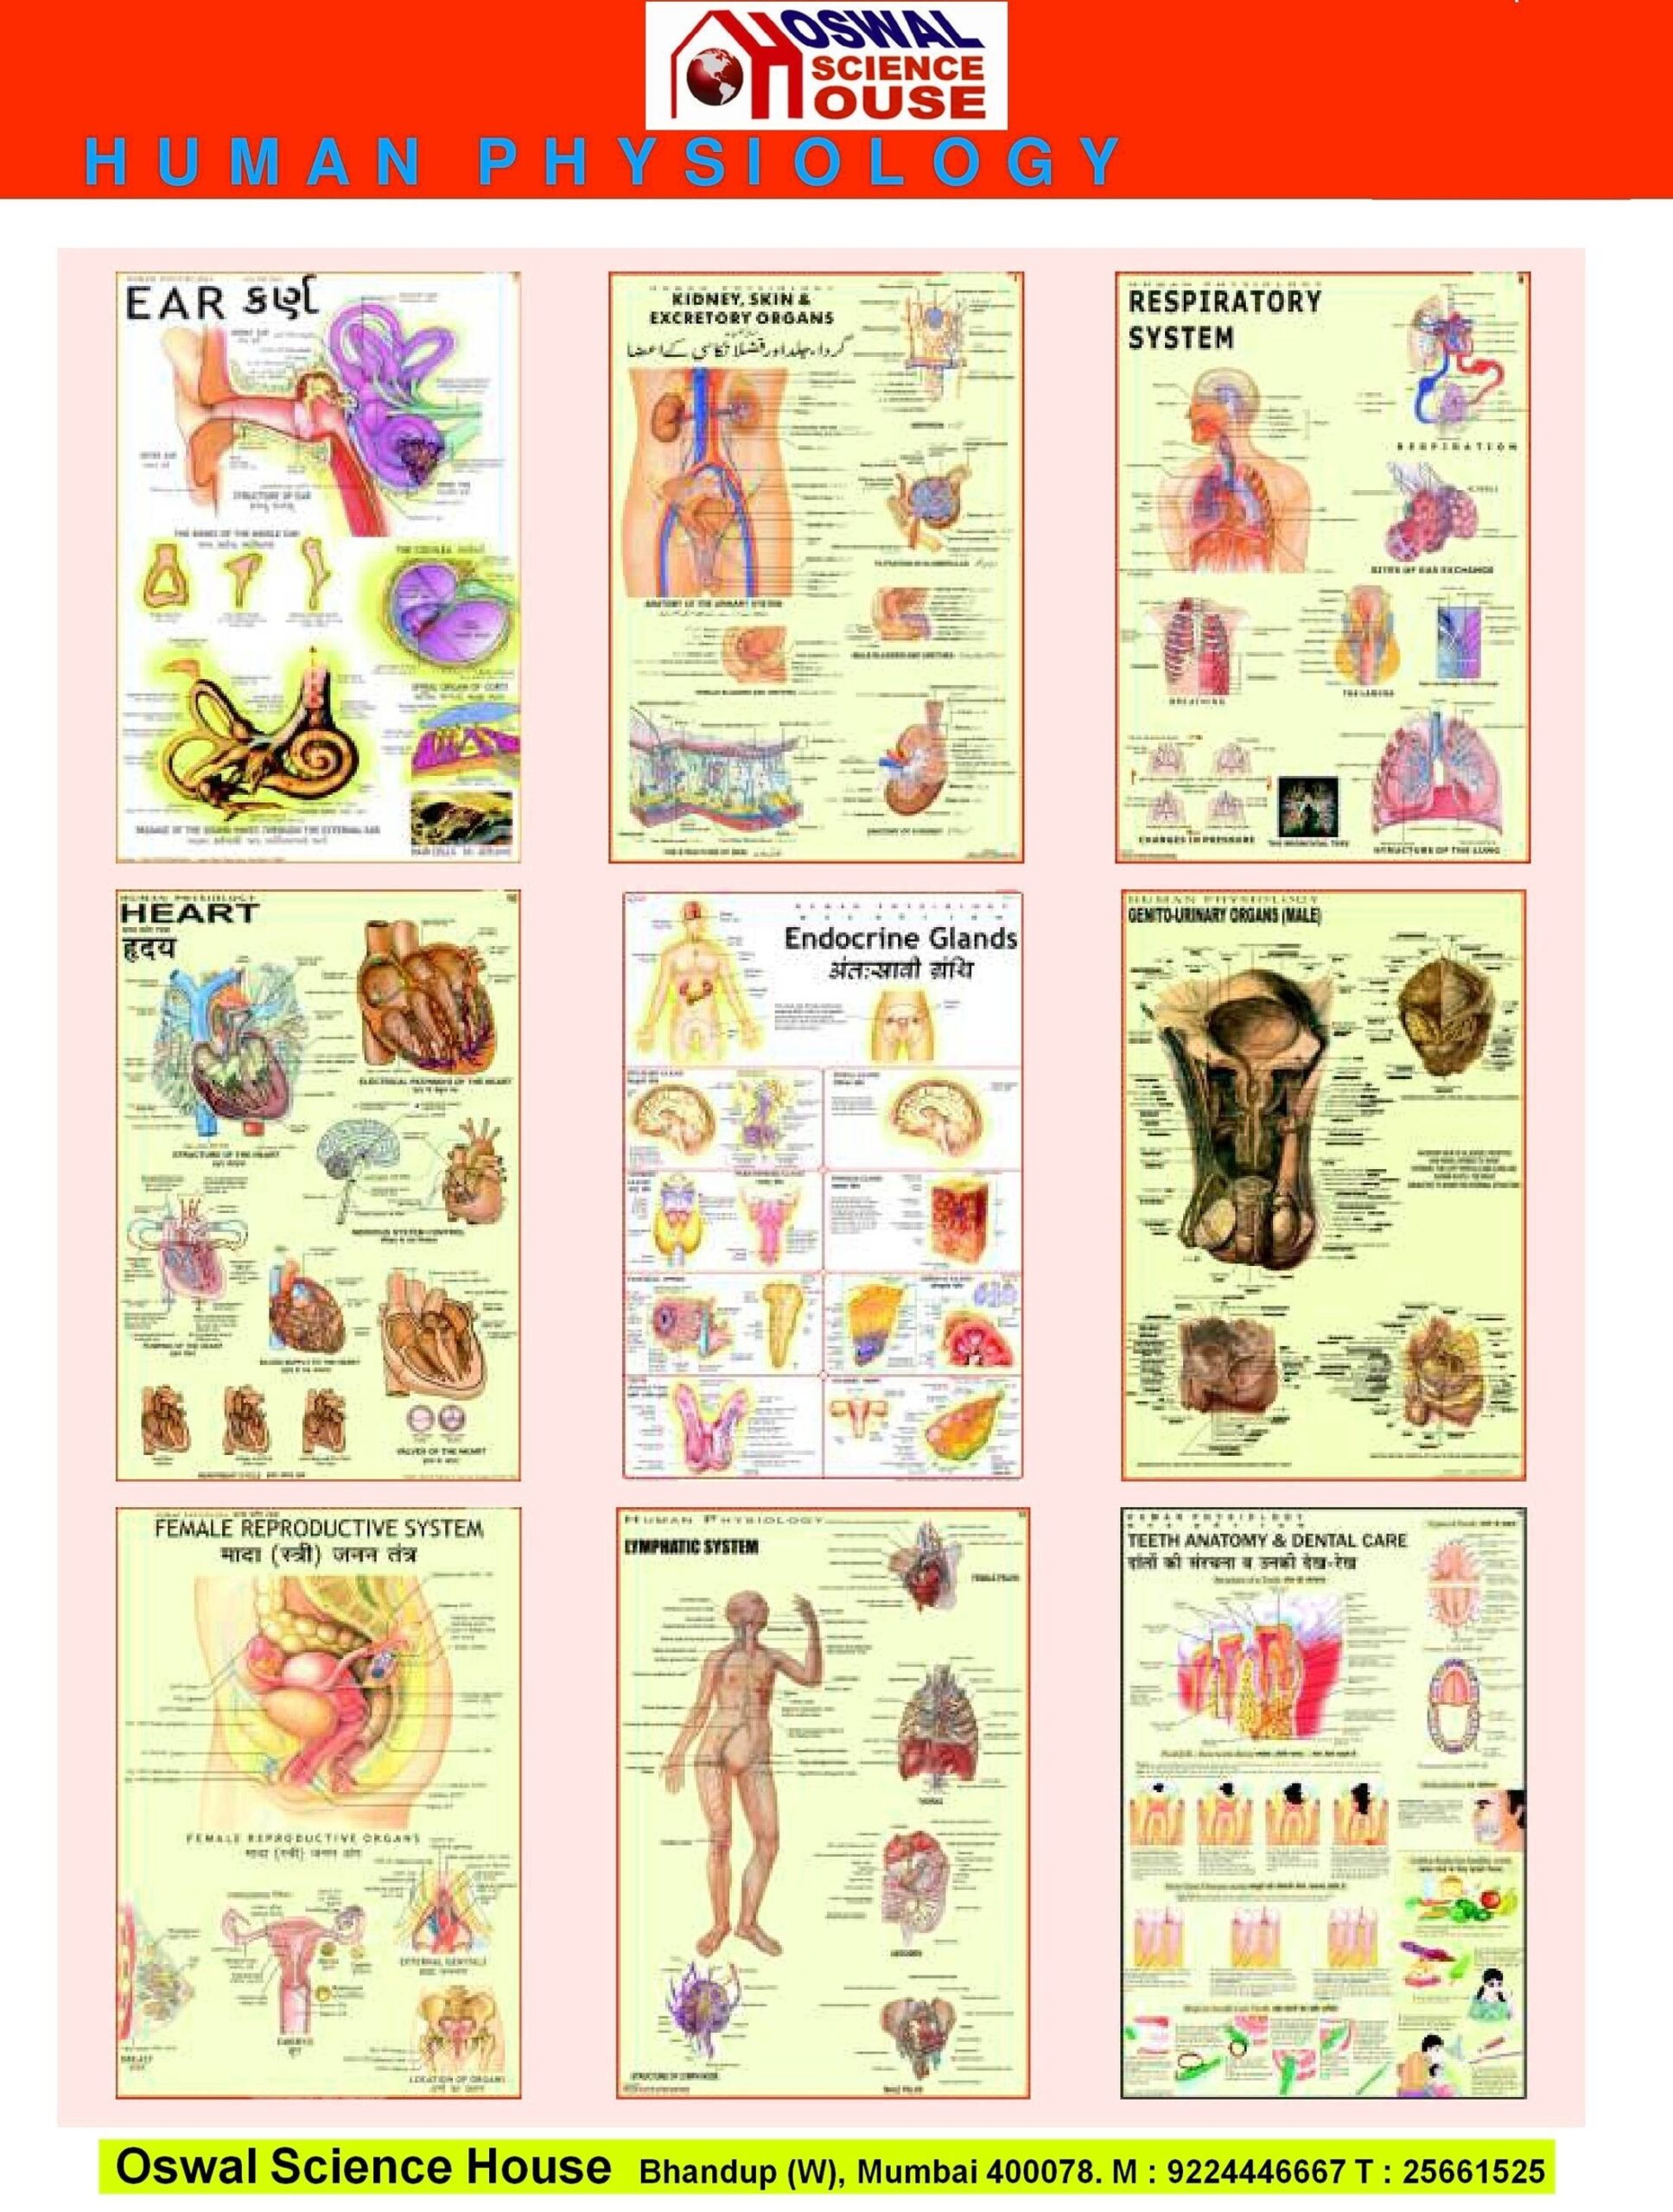
Human Physiology: Human physiology studies the functions and mechanisms of the human body, covering systems such as the circulatory, respiratory, nervous, and digestive systems. It explores how these systems interact to maintain homeostasis and overall health.

anatomy and physiology, biological functions, body systems chart, human body processes, human physiology diagram

Post navigation

← Previous Previous post: Timing Market And Economic Cycle Phases
Next → Next post: Geography Of The Four Seasons

Primary Sidebar Widget Area

Top Diagrams

Latest Posts

  • How to Stop Time from Flying
  • Kenya Population
  • British Virgin Islands Population
  • Chemistry Experiment Illustration
  • European Union Population
  • Assessment Flow Chart
  • West Bank and Gaza Population
  • United States Births per woman
  • Liberia Population
  • Us Gdp Growth Chart
  • Mauritius Births per woman
  • Global Economy 2021
  • Number Of Americans Over 55 Years Old
  • Scientific Diagram
  • History Diagram
  • Smale horseshoe tranformation

Top Tags

  • sizes (35)
  • size chart (35)
  • size conversion (35)
  • economy chart (33)
  • economy graph (33)
  • economy diagram (33)
  • cell (29)
  • cell diagram (29)
  • cell illustration (29)
  • window (24)
  • window diagram (24)
  • types of windows (24)
  • origami (16)
  • origami steps (16)
  • how to make origami (16)
  • biology (16)
  • biology diagram (16)
  • yoga (8)
  • yoga routine (8)
  • yoga poses (8)

Categories

  • anatomy
  • Business
  • chart
  • Demographics
  • Eco
  • Ecom
  • Economy
  • Explained
  • GDP
  • Health
  • Maps
  • notice
  • science
  • Signs
  • Sizes
  • Uncategorized

Useful Resources

  • Chart Diagram
  • Meme Gif
  • Logo Sign
  • Human Anatomy
  • Graph Diagram
  • Economy GDP
  • Twitter
Copyright © 2025 Ygraph. All Rights Reserved.
Theme: Catch Box by Catch Themes
Scroll Up
WP Twitter Auto Publish Powered By : XYZScripts.com