Vietnam Births per woman

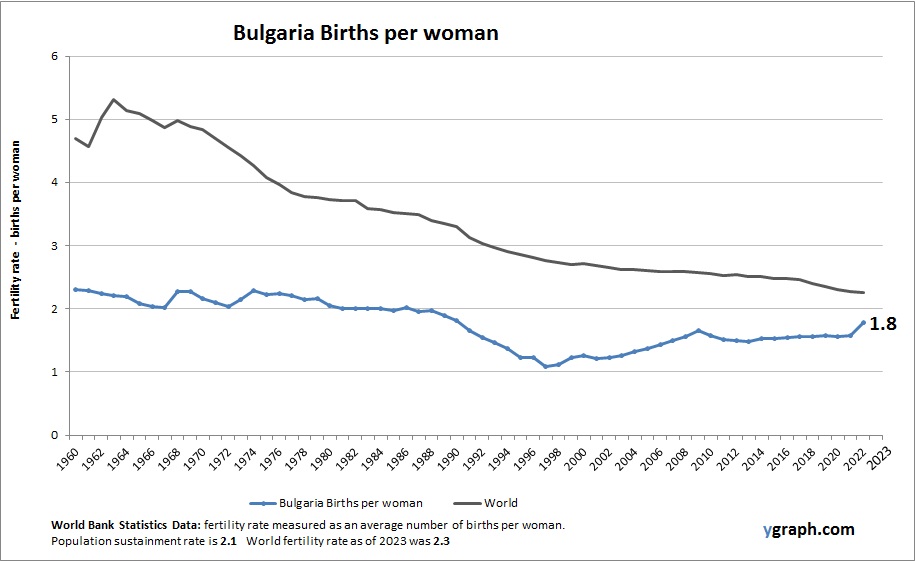
This diagram presents Vietnam Births per woman. This is according to World Bank birth stats by country. Latest births per woman information for Vietnam.

Vietnam has a relatively low fertility rate, influenced by long-standing population policies and rapid economic development. Urbanization, improved healthcare, and education have supported smaller families, though regional differences remain between rural and urban areas.

Vietnam Births per woman

India Population

The above graph shows India Population. The country statistics are compiled by World Bank. Latest population information for India.

India is the second most populous country globally, with a large and youthful population. Rapid population growth has slowed due to declining fertility rates but remains substantial due to the base population size. Urbanization, economic development, and improvements in health and education continue to shape demographic trends, with regional variations influencing policy and planning.

India Population

Heavily indebted poor countries (HIPC) Population

This diagram presents Heavily indebted poor countries (HIPC) Population. World Bank is the source of this population data. Based on the latest available information for Heavily indebted poor countries (HIPC).

HIPC countries often experience high population growth driven by elevated fertility rates and youthful demographics. Development challenges such as limited access to healthcare, education, and employment impact demographic structures and long-term population planning.

Heavily indebted poor countries (HIPC) Population

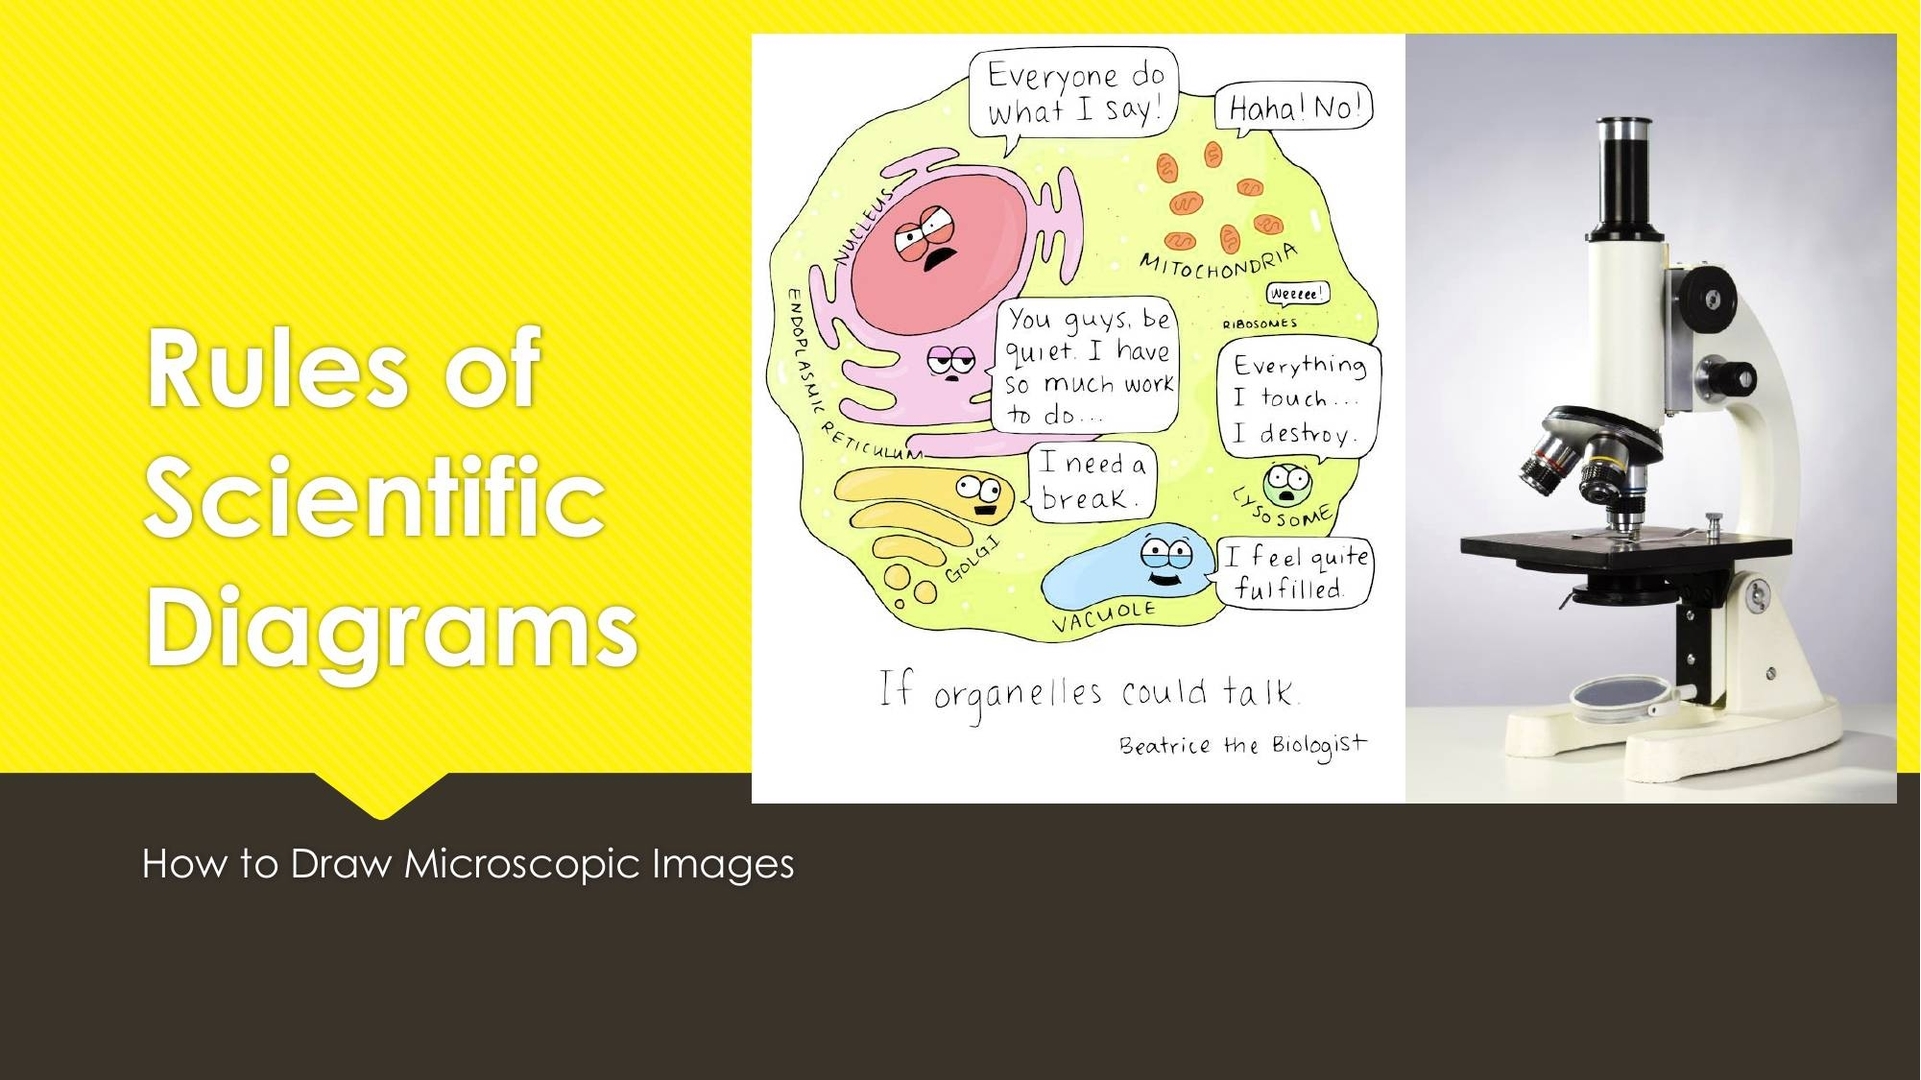
Biology Diagrams Sample Of

Biology Diagrams Sample Of: Biology diagrams include detailed illustrations of cellular structures, organ systems, and biological processes. Examples include diagrams of the human heart, plant cells, and the process of photosynthesis, aiding in the understanding of complex biological concepts.

Biology Diagrams Sample Of

Womens Size Chart

Womens Size Chart: A women’s size chart provides a standardized guide for selecting clothing sizes based on body measurements, including bust, waist, and hip dimensions. Sizes may be listed numerically (e.g., 2, 4, 6) or alphabetically (XS, S, M, L, XL), and may also offer specialized categories like petite, tall, or plus sizes. These charts are crucial in ensuring proper fit across various brands and styles, especially in an era where sizing can differ significantly by manufacturer or country.

Women's Size Chart

Animal Cell Anatomy Diagram

Animal Cell Anatomy Diagram: An animal cell anatomy diagram showcases the internal structures and organelles that make up the basic unit of animal life. It usually includes labeled parts such as the nucleus (the control center of the cell), nucleolus, mitochondria (the powerhouse of the cell), endoplasmic reticulum (smooth and rough), Golgi apparatus, lysosomes, ribosomes, and centrosomes. The cell membrane surrounds the cell, regulating what enters and leaves, while the cytoplasm serves as the medium for chemical reactions. This type of diagram is essential in biology education for visualizing and understanding cell function and structure.

Biological Diagrams

Uzbekistan Population

The above graph shows Uzbekistan Population. The country statistics are compiled by World Bank. Based on the latest demographics info provided for Uzbekistan.

Uzbekistan has a large and youthful population experiencing moderate growth. Fertility rates have declined but remain above replacement level, supported by improved healthcare and education. Urbanization is progressing rapidly, especially in cities like Tashkent, while rural areas maintain traditional family structures. The country’s economic diversification and regional migration trends influence demographic shifts and social development.

Uzbekistan Population

Biology Diagrams Examined

Biology Diagrams Examined: Biology diagrams are visual tools that illustrate complex biological processes and structures. They include representations of cellular components, metabolic pathways, and anatomical features, aiding in the understanding and communication of biological concepts.

Biology Diagrams Examined

El Salvador Population

The above graph shows El Salvador Population. World Bank is the source of this population data. Latest population information for El Salvador.

El Salvador’s population growth has slowed in recent years due to declining fertility and significant emigration. Urbanization and economic pressures have led to smaller families, with remittances from abroad playing a major role in the country’s economy and demographics.

El Salvador Population

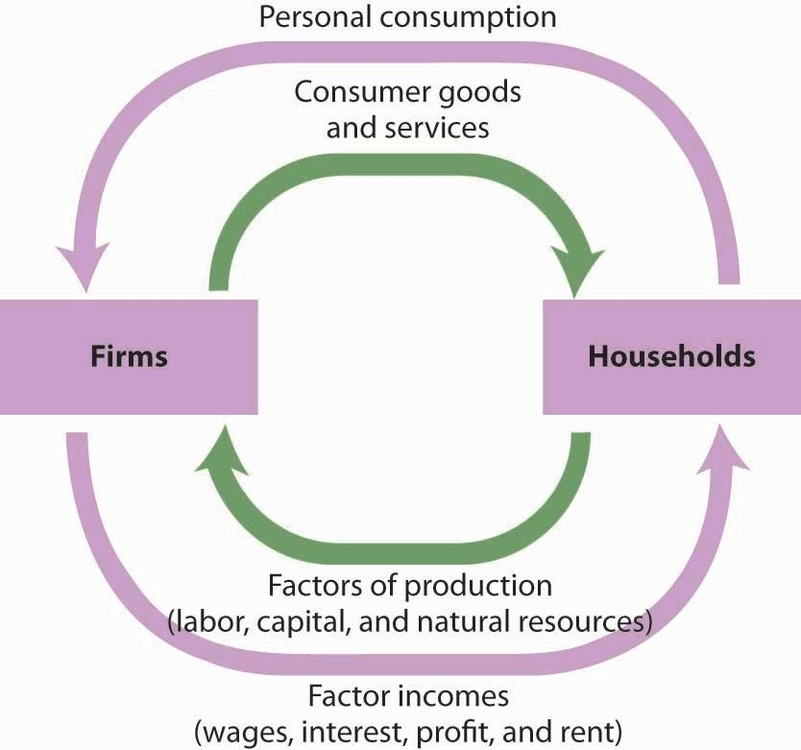
Economic Growth Diagram

Economic growth is the increase in the production of goods and services in an economy over time. It is commonly measured in terms of the increase in aggregated market value of additional goods and services produced, using estimates such as Gross Domestic Product (GDP) . Economic growth is an important macroeconomic objective because it enables increased living standards, improved tax revenues, and helps to create new jobs .

Economic growth can be achieved through various means, including increases in capital goods, labor force, technology, and human capital . Capital goods refer to physical assets such as machinery, buildings, and infrastructure that are used to produce other goods and services. Labor force refers to the number of people who are employed or seeking employment. Technology refers to the knowledge, tools, and techniques used to produce goods and services. Human capital refers to the knowledge, skills, and abilities of the workforce .

Economic growth can be measured in nominal or real terms. Nominal economic growth is the increase in the production of goods and services in an economy without adjusting for inflation. Real economic growth is the increase in the production of goods and services in an economy after adjusting for inflation .

Economic growth can be divided into four phases: expansion, peak, contraction, and trough . During the expansion phase, employment, income, industrial production, and sales all increase, and there is a rising real GDP. The peak phase is when an economic expansion hits its ceiling. It is in effect a turning point. During the contraction phase, the elements of an expansion all begin to decrease. It becomes a recession when a significant decline in economic activity spreads across the economy. The trough phase is when an economic contraction hits its nadir .

Tax cuts are generally less effective in spurring economic growth than are increases in government spending . If the rewards of economic growth go only to an elite group, then it is unlikely that the growth will be sustainable .

In conclusion, economic growth is the increase in the production of goods and services in an economy over time. It can be achieved through various means, including increases in capital goods, labor force, technology, and human capital. Economic growth is commonly measured in terms of

Economic Growth Diagram