Shifting cultivation is a form of agriculture that involves moving from one plot of land to another after a few years of cropping. It is practiced mainly in tropical and subtropical regions, where soil fertility is low and rainfall is unpredictable. Shifting cultivation has both advantages and disadvantages for the environment and the people who practice it. Here is an essay of about 1000 words on shifting cultivation:
hifting cultivation, also known as slash-and-burn agriculture, is a farming system that has been used for thousands of years by indigenous people in many parts of the world. It is based on the principle of rotating crops and fallows, or periods of rest for the land, to maintain soil fertility and prevent pest and disease outbreaks. Shifting cultivation is usually practiced in areas where the natural vegetation is forest or woodland, and where the population density is low.
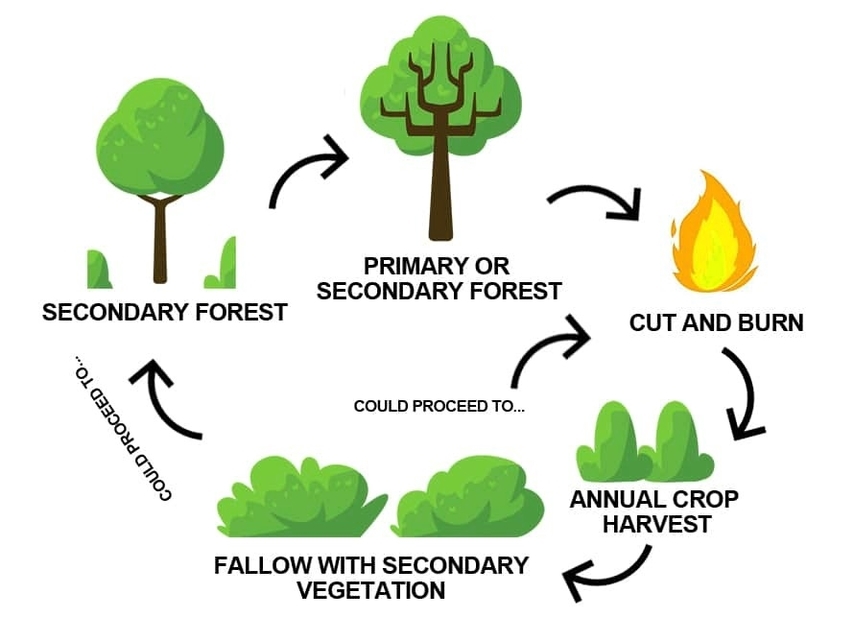
The process of shifting cultivation involves clearing a patch of land by cutting down the trees and shrubs, and burning them to create ash that enriches the soil. The cleared land, called a swidden, is then planted with crops such as rice, maize, cassava, yams, and vegetables. The crops are harvested for two or three years, until the soil becomes exhausted or the weeds become too difficult to control. The farmers then abandon the swidden and move to a new location, where they repeat the cycle. The old swidden is left to regenerate naturally, and may be reused after a period of time, usually 10 to 20 years, depending on the local conditions.
hifting cultivation has several benefits for the environment and the people who practice it. First, it is a low-input and low-cost system that does not require external inputs such as fertilizers, pesticides, or irrigation. It relies on the natural processes of nutrient cycling and biological diversity to sustain crop production. Second, it is a flexible and adaptive system that can cope with the variability and uncertainty of the climate and the soil. It allows the farmers to adjust the size, location, and duration of their swiddens according to the availability of land and water, and the demand for food. Third, it is a system that preserves and enhances the biodiversity of the ecosystem. By creating a mosaic of different stages of forest succession, shifting cultivation maintains a high diversity of plant and animal species, and provides habitats and resources for wildlife. Fourth, it is a system that respects and reflects the culture and knowledge of the local people. It is based on the traditional ecological knowledge and practices of the farmers, who have a deep understanding of the local environment and its dynamics. It also supports the social and economic well-being of the farmers, who have access to a variety of food and non-food products from their swiddens and fallows,