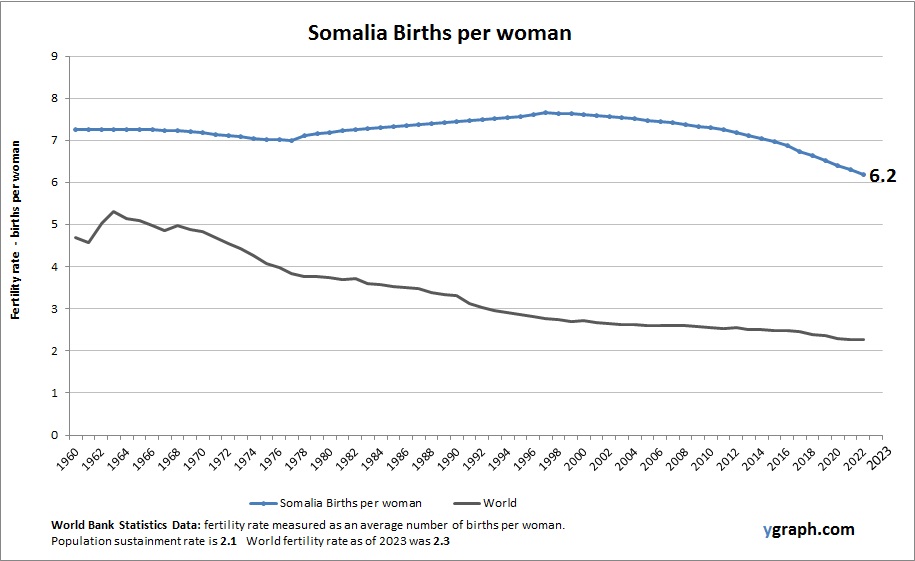
Guyana Births per woman

Chart above demonstrates Guyana Births per woman. This is according to World Bank birth stats by country. Based on the latest demographics info provided for Guyana.

Guyana’s fertility rate has been gradually declining as urbanization increases and education improves, although rural areas maintain higher birth rates. The country’s ethnically diverse population experiences varying demographic patterns, with migration also influencing population size and structure. Economic challenges and development initiatives affect reproductive health access.

Guyana Births per woman

North America Population

This diagram presents North America Population. The country statistics are compiled by World Bank. Latest population information for North America.

North America’s population is diverse and steadily increasing, driven by relatively higher fertility rates in some areas and strong immigration flows. The demographic structure varies widely, from aging populations in Canada to younger, growing populations in parts of the United States and Mexico.

North America Population

North America Births per woman

This diagram presents North America Births per woman. This is according to World Bank birth stats by country. Latest births per woman information for North America.

North America experiences moderate fertility rates overall, with significant variation among different ethnic and socioeconomic groups. Factors such as urbanization, education, healthcare access, and cultural diversity influence birth rates. Immigration sustains population growth, while many native-born populations exhibit below-replacement fertility. Demographic trends shape policy debates around healthcare, education, and workforce development.

North America Births per woman

New Zealand Population

The above graph shows New Zealand Population. This is according to World Bank total population stats. Latest population information for New Zealand.

New Zealand’s population continues to grow, largely supported by immigration, as fertility rates have declined below replacement level. The country’s demographic profile reflects an aging population, with strong multicultural influences shaping societal and economic development.

New Zealand Population

Left Right Political Spectrum Chart

Left Right Political Spectrum: The left-right political spectrum categorizes political ideologies based on their economic and social policies. Left-wing ideologies support social equality and government intervention, while right-wing ideologies emphasize individual liberty and free-market principles.

Left Right Political Spectrum Chart

Nauru Births per woman

Chart above demonstrates Nauru Births per woman. World Bank is the source of this birth data. Latest births per woman information for Nauru.

Nauru has a moderately high fertility rate, influenced by cultural traditions and relatively limited access to family planning services. As a small island nation, its population dynamics are sensitive to migration and economic fluctuations, with community ties playing an important role in family size decisions.

Nauru Births per woman

Probability Tree Diagram

Probability trees are visual tools that help us calculate probabilities for different scenarios involving one or more events. They show the possible outcomes of each event and the probabilities of each branch. To find the probability of a particular outcome, we multiply the probabilities along the branches and add the probabilities down the columns. Here is an example of a probability tree for tossing a coin twice:

“`latex
begin{tikzpicture}[grow=right, sloped] node[bag] {}
child {
node[bag] {T}
child {
node[end, label=right:
{T,T $0.5 times 0.5 = 0.25$}] {}
edge from parent
node[above] {$0.5$}
}
child {
node[end, label=right:
{T,H $0.5 times 0.5 = 0.25$}] {}
edge from parent
node[above] {$0.5$}
}
edge from parent
node[above] {$0.5$}
}
child {
node[bag] {H}
child {
node[end, label=right:
{H,T $0.5 times 0.5 = 0.25$}] {}
edge from parent
node[above] {$0.5$}
}
child {
node[end, label=right:
{H,H $0.5 times 0.5 = 0.25$}] {}
edge from parent
node[above] {$0.5$}
}
edge from parent
node[above] {$0.5$}
};
end{tikzpicture}
“`

The first set of branches shows the possible outcomes of the first toss: heads (H) or tails (T), each with a probability of 0.5. The second set of branches shows the possible outcomes of the second toss, given the first toss. For example, if the first toss is heads, then the second toss can be either heads or tails, each with a probability of 0.5. The end points of the tree show the four possible outcomes of tossing a coin twice: HH, HT, TH, TT. Each outcome has a probability of 0.5 x 0.5 = 0.25, since we multiply the probabilities along the branches. To find the probability of a certain event, we add the probabilities of the outcomes that satisfy the event. For example, the probability of getting at least one head is 0.25 +

Probability Tree Diagram

Slovenia Births per woman

This diagram presents Slovenia Births per woman. This is according to World Bank birth stats by country. Based on the latest available information for Slovenia.

Slovenia has a low fertility rate, typical of many European Union countries. Women are having fewer children, often later in life, due to career considerations and economic factors. The government has implemented family-friendly policies to encourage childbirth, but demographic aging remains a key issue.

Slovenia Births per woman