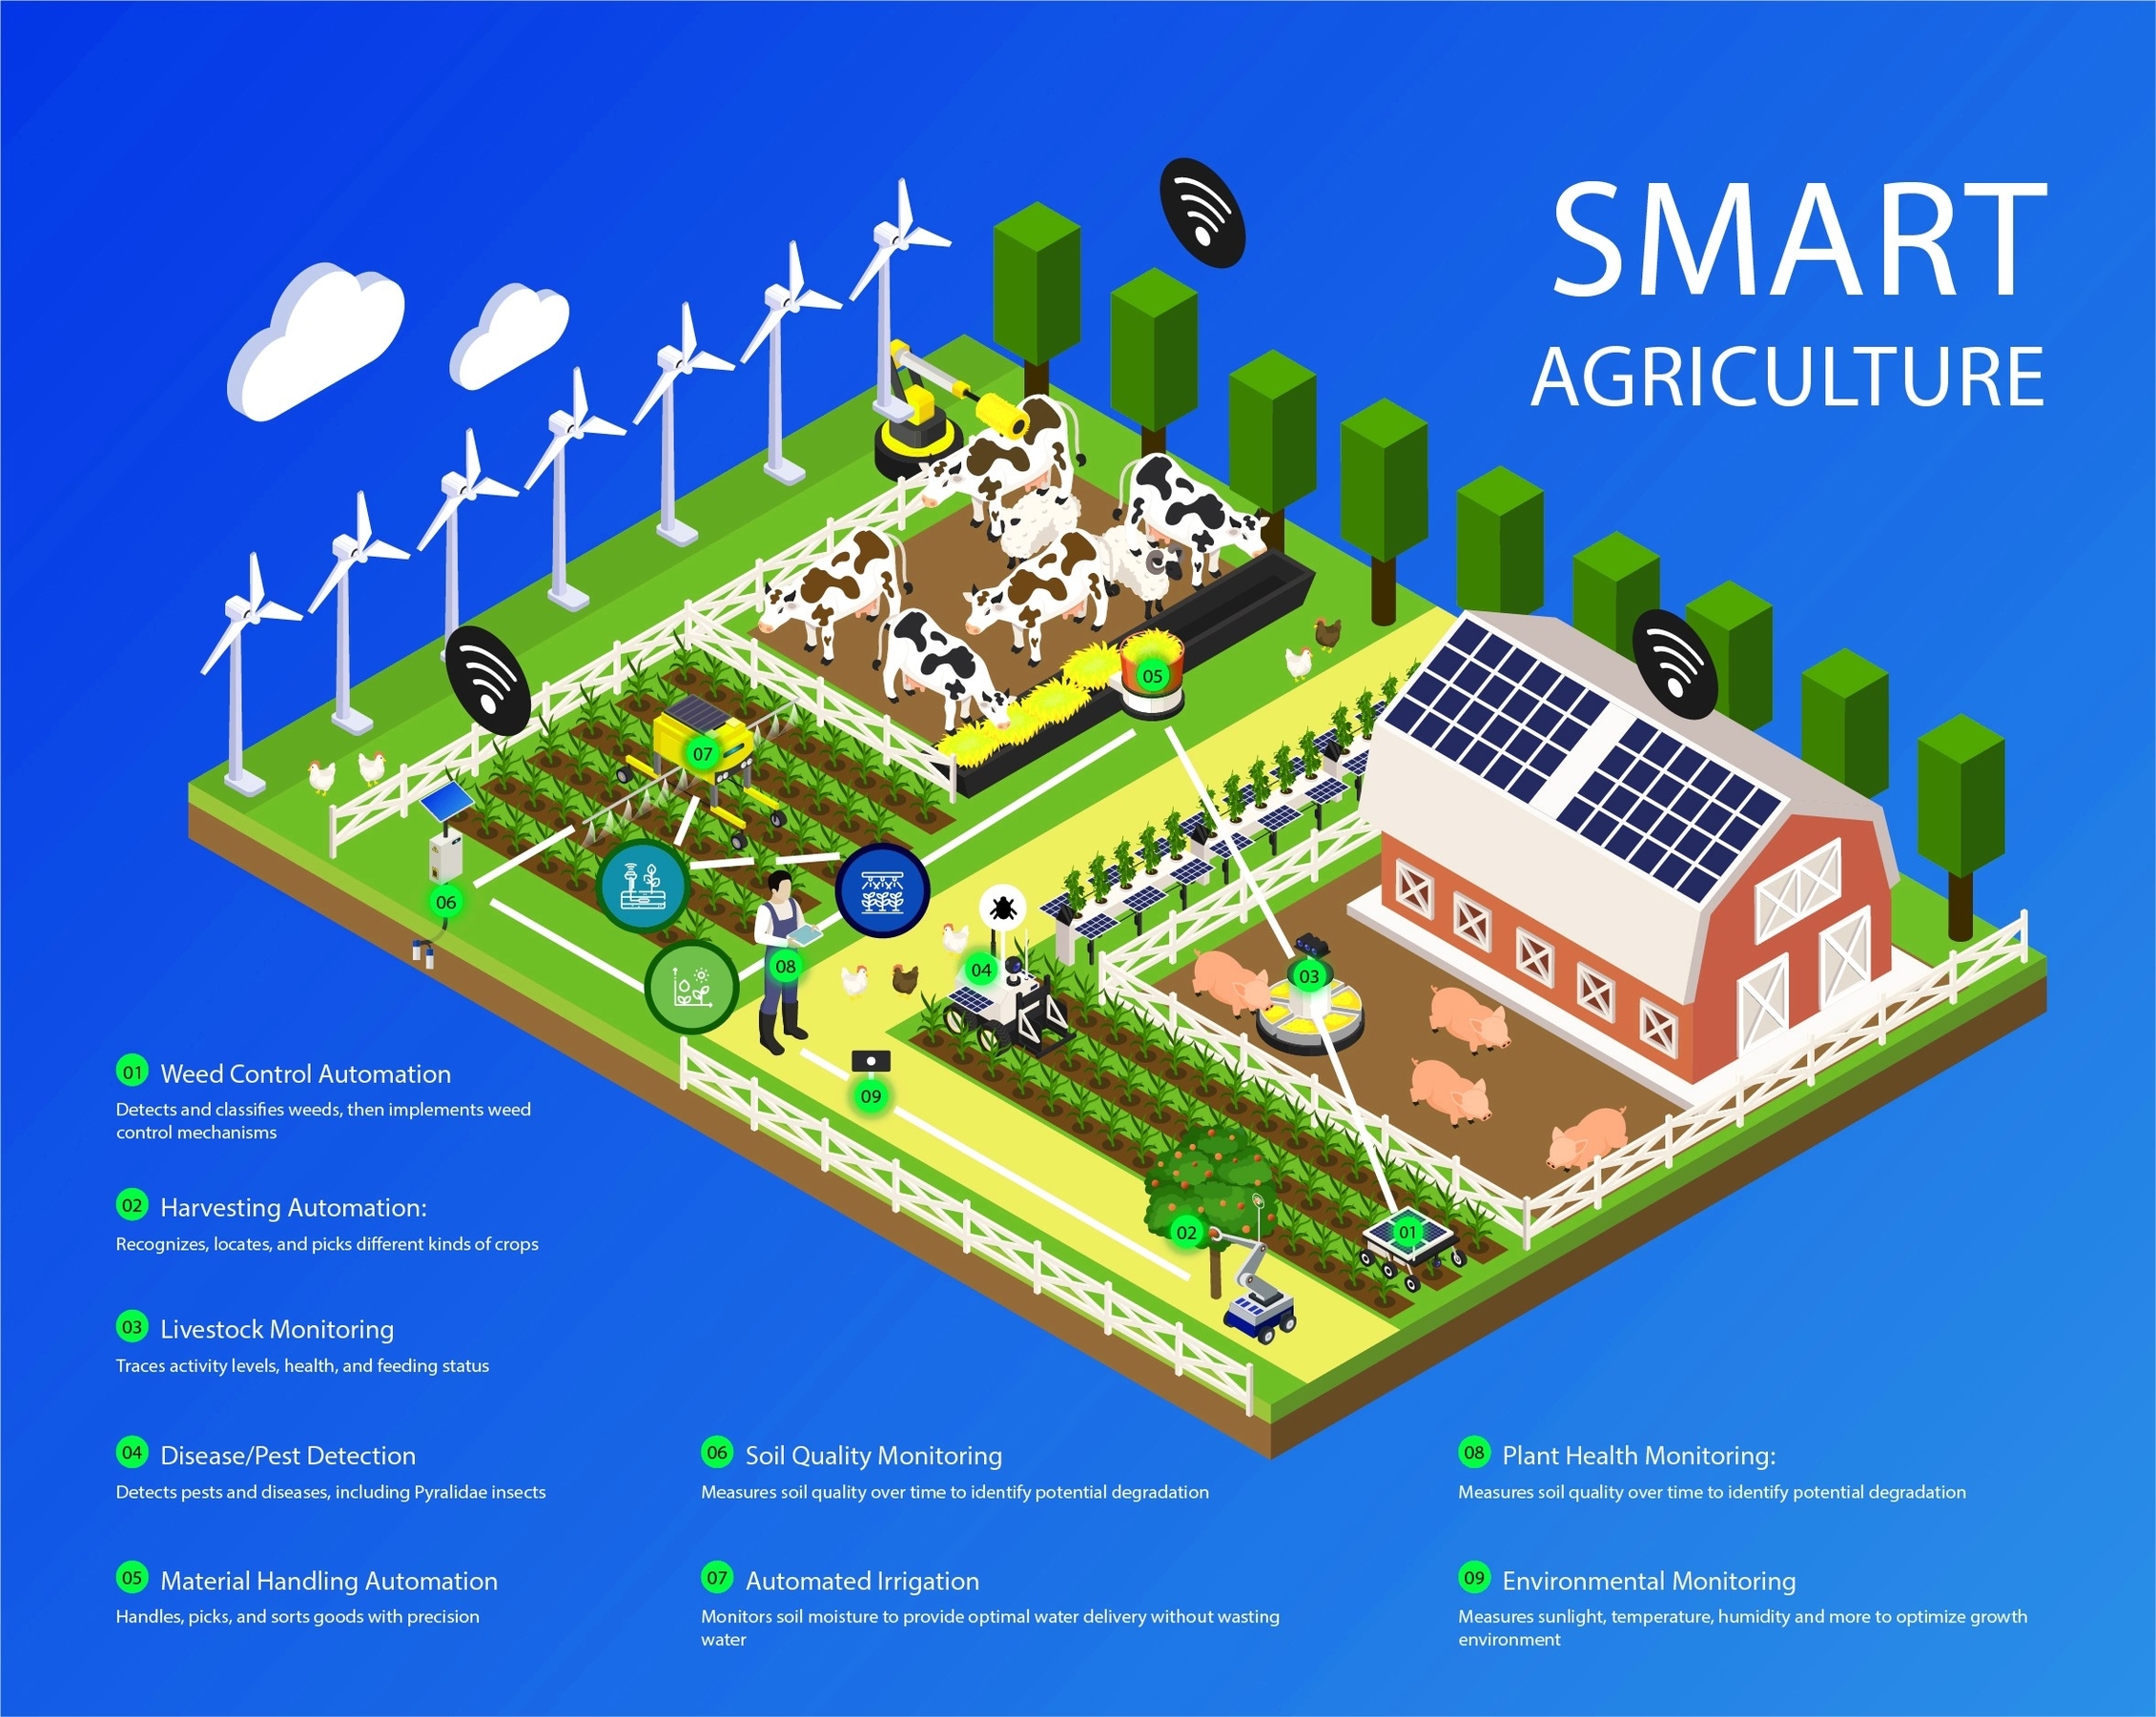
Milestone Trend Analysis

Milestone Trend Analysis (MTA) is a project management technique that helps project managers track the progress of their projects. It is a tool that enables the project team to visualize if the work corresponding to certain project milestones is ahead of, on, or behind schedule. MTA is one of the most used tools in controlling the project schedule .

To use MTA, we need a project schedule including its related milestone plan first. At the beginning of the implementation phase, we ask the team members responsible for the milestones for their planning status. We then present the results as an MTA chart on our project management dashboard. The vertical axis of the chart is called the “planning line.” If we start the project on time, we can tick off the first milestone, Project Start. By the end of the first month into the implementation phase, we ask the team members responsible for the milestones M1 to M4 for their best guesses when these milestones could be reached. We then obtain a monthly status of the trend of our project milestones by following that routine .

MTA charts can help project managers assess the health of a project and provide valuable insights about scheduling or scope for future initiatives . By looking at the milestone trend analysis chart, stakeholders can understand the direction the project is heading in and take remedial actions if required . MTA visualizes the defined milestones from the start to the planned finish date. The horizontal axis is divided into reporting dates, for example weeks or months .

In case the trend for one particular milestone points upward, we shall analyze the situation together with the experts of the work packages which contribute to that milestone, and decide on actions in order to achieve a horizontal trend, or maybe even one that points downwards. Only if we enter that analysis we turn our milestone trend indicator into a real “milestone trend analysis” tool .

In summary, MTA is a useful tool for project managers to track the progress of their projects. It helps the project team to visualize if the work corresponding to certain project milestones is ahead of, on, or behind schedule. MTA charts can help project managers assess the health of a project and provide valuable insights about scheduling or scope for future initiatives. By looking at the milestone trend analysis chart, stakeholders can understand

Milestone Trend Analysis

Smart Agriculture

Smart Agriculture is a term that refers to the use of advanced technologies and data-driven methods to optimize and improve the sustainability of agricultural production. Smart Agriculture aims to address the interlinked challenges of food security, climate change, and profitability in the agri-food sector. Some of the technologies that are used for Smart Agriculture include artificial intelligence (AI), automation, the Internet of Things (IoT), sensors, robots, and satellite-based global positioning systems (GPS).
mart Agriculture is based on the concept of precision agriculture, which dates back to the 1980s and focuses on the variability of soil and crop conditions within a field. Precision agriculture uses data from yield monitors, GPS mapping, and soil sampling to apply the right amount of inputs (such as fertilizer, water, and pesticides) to the right place at the right time. Precision agriculture helps to increase crop yields, reduce costs, and minimize environmental impacts.
mart Agriculture goes beyond precision agriculture by integrating more technologies and data sources to enable real-time monitoring, analysis, and decision-making for farm operations. Smart Agriculture leverages AI to process large amounts of data from various sources, such as sensors, drones, satellites, weather stations, and farm management software. AI can also provide insights and recommendations for farmers, such as optimal planting dates, irrigation schedules, pest control strategies, and harvest times. AI can also automate some of the farm tasks, such as seeding, weeding, spraying, and harvesting, using robots and autonomous vehicles.
mart Agriculture also uses IoT to connect different devices and systems on the farm, such as sensors, cameras, machines, and mobile phones. IoT enables data collection and transmission, as well as remote control and coordination of farm activities. IoT can also facilitate traceability and transparency of the food supply chain, by providing information on the origin, quality, and safety of the food products.

The benefits of Smart Agriculture are manifold. Smart Agriculture can help to:

– Increase productivity and quality of food production, by optimizing the use of inputs, enhancing crop and livestock performance, and reducing losses and waste.
– Enhance resilience and adaptation to climate change, by improving the management of weather and climate risks, diversifying the production systems, and increasing the use of climate-resilient crop varieties and practices.
– Reduce greenhouse gas emissions and environmental impacts, by lowering the use of fossil fuels,

Smart Agriculture

Precision Agriculture Technology

Precision Agriculture Technology (PAT) is a modern farming technique that utilizes advanced technology to optimize crop production. It involves using sensors, GPS, and data analysis to tailor crop management strategies to specific fields, increasing efficiency and reducing costs . The goal of PAT is to maximize yields while minimizing waste and environmental impact.

PAT is a combination of various technologies that work together to provide farmers with a comprehensive view of their fields. These technologies include soil sensors, drones, GPS, and machine learning algorithms . Soil sensors are used to measure soil moisture, temperature, and nutrient levels, which can help farmers determine the optimal time to plant, irrigate, and fertilize their crops. Drones equipped with cameras and sensors can be used to monitor crop health, detect pests and diseases, and identify areas that require attention . GPS technology is used to map fields and track the movement of farm equipment, allowing farmers to optimize their operations and reduce fuel consumption . Machine learning algorithms can be used to analyze data from various sources, such as weather forecasts and soil sensors, to provide farmers with insights into crop growth and yield potential .

The benefits of PAT are numerous. By using data to optimize crop management, farmers can increase yields, reduce waste, and improve profitability . PAT can also help farmers reduce their environmental impact by minimizing the use of water, fertilizer, and pesticides . Additionally, PAT can help farmers reduce labor costs by automating tasks such as irrigation and fertilization .

In conclusion, Precision Agriculture Technology is a modern farming technique that utilizes advanced technology to optimize crop production. By using sensors, GPS, and data analysis, farmers can tailor crop management strategies to specific fields, increasing efficiency and reducing costs. The benefits of PAT are numerous, including increased yields, reduced waste, improved profitability, and reduced environmental impact. PAT is an exciting development in the field of agriculture, and it has the potential to revolutionize the way we grow crops and feed the world..

Precision Agriculture Technology

Stages Of The Economic Cycle

The economic cycle, also known as the business cycle, refers to the fluctuations in economic activity between periods of expansion and contraction. The cycle is characterized by four stages: expansion, peak, contraction, and trough . The current stage of the cycle is determined by factors such as gross domestic product (GDP), interest rates, total employment, and consumer spending . Understanding the economic cycle can help investors and businesses determine when to make investments and when to pull their money out, as each cycle impacts stocks and bonds as well as profits and corporate earnings .

The first stage of the economic cycle is the expansion stage. During this stage, the economy experiences relatively rapid growth, interest rates tend to be low, and production increases. The economic indicators associated with growth, such as employment and wages, corporate profits and output, aggregate demand, and the supply of goods and services, tend to show sustained uptrends through the expansionary stage. The flow of money through the economy remains healthy and the cost of money is cheap. However, the increase in the money supply may spur inflation during the economic growth phase .

The second stage of the economic cycle is the peak stage. The peak of a cycle is when growth hits its maximum rate. Prices and economic indicators may stabilize for a short period before reversing to the downside. Peak growth typically creates some imbalances in the economy that need to be corrected. As a result, businesses may start to reevaluate their budgets and spending when they believe that the economic cycle has reached its peak .

The third stage of the economic cycle is the contraction stage. A correction occurs when growth slows, employment falls, and prices stagnate. As demand decreases, businesses may not immediately adjust production levels, leading to oversaturated markets with surplus supply and a downward movement in prices. If the contraction continues, the recessionary environment may spiral into a depression .

The fourth and final stage of the economic cycle is the trough stage. The trough of the cycle is reached when the economy hits a low point, with supply and demand hitting bottom before recovery. The low point in the cycle represents a painful moment for

Stages Of The Economic Cycle

China Economy Graph

China is the world’s second-largest economy and has been growing at an impressive rate over the past few decades. According to a report by KPMG China, China’s GDP grew 5.5% year-over-year (yoy) in 2023 H1, posting a steady economic rebound. In Q2, the economy rose by 6.3%, up from 4.5% in Q1, largely thanks to a low base. However, the country is currently facing some economic challenges. In a recent speech, Chinese leader Xi Jinping acknowledged that companies have had a “tough time,” and that people have had “difficulty finding jobs.” The property market is a major contributor to China’s economic problems. Until recently, real estate accounted for a third of its entire wealth. A global pandemic and a shrinking population at home are not good ingredients for a program of relentless housebuilding. The government, fearing a US-style 2008 meltdown, then put limits on how much developers could borrow. Soon they owed billions they could not pay back. Now demand for houses has slumped and property prices have plunged. This has made Chinese homeowners – emerging from three years of tough coronavirus restrictions – poorer .

Despite these challenges, China has been investing heavily in “future industries” such as artificial intelligence, biotechnology, and new energy vehicles. In 2021, “future industries” was included in China’s Outline of the 14th Five-Year Plan (2021-25) for National Economic and Social Development and Vision 2035. At present, seven provinces and municipalities as well as more than 20 prefecture-level cities nationwide have issued more than 30 policy documents relevant to future industries .

In conclusion, China’s economy has been growing at an impressive rate over the past few decades, but it is currently facing some economic challenges. The country is investing heavily in “future industries” to help spur economic growth in the coming years.

China Economy Graph

Force Diagram Physics 33

Physics 33 is a course that covers the fundamental principles of particle physics. One of the topics covered in this course is the four basic forces of nature: gravity, electromagnetic force, weak nuclear force, and strong nuclear force . These forces are responsible for all the interactions between particles in the universe.

Gravity is the weakest of the four forces and is responsible for the attraction between massive objects. Electromagnetic force is responsible for the interaction between charged particles and is much stronger than gravity. The weak nuclear force is responsible for radioactive decay and is much weaker than the electromagnetic force. The strong nuclear force is responsible for holding the nucleus of an atom together and is the strongest of the four forces .

Particle physics is intimately tied to these four forces. Certain fundamental particles, called carrier particles, carry these forces, and all particles can be classified according to which of the four forces they feel . The table below summarizes important characteristics of the four basic forces:

| Force | Approximate Relative Strength | Range | Carrier Particle |
|———–|———————————|———–|———————-|
| Gravity | 10^-38 | ? | Graviton (conjectured)|
| Electromagnetic | 10^-2 | ? | Photon (observed) |
| Weak Nuclear | 10^-13 | <10^-18 m | W+, W-, Z0 (observed) | | Strong Nuclear | 1 | <10^-15 m | Gluons (conjectured) | The search for a correct theory linking the forces, called the Grand Unified Theory (GUT), is explored in this course in the realm of particle physics. The unification of forces follows a long tradition. In the 19th century, the distinct electric and magnetic forces were shown to be intimately connected and are now collectively called the electromagnetic force. More recently, the weak nuclear force has been shown to be connected to the electromagnetic force in a manner suggesting that a theory may be constructed in which all four forces are unified .

Force Diagram Physics 33

U.s. Population Distribution By Age

The United States of America has a population of approximately 333.29 million people as of 2022. The largest age group in the US is adults aged 30 to 34, with around 11.84 million males and 11.47 million females in this category.

According to Statista, in 2022, about 17.96% of the US population fell into the 0-14 year category, 64.91% into the 15-64 age group, and 17.13% of the population were over 65 years of age.

The US population has been aging over the years, with the proportion of people aged 65 and above increasing. In 2021, the number of people aged 65 and above was 16.6% of the total population.

The US Census Bureau provides a detailed breakdown of the US population by age and sex. As of July 1, 2022, the resident population of the United States by sex and age was as follows :

| Age in years | Male | Female |
|—————-|———|———–|
| Under 5 | 9.48 | 9.06 |
| 5 to 9 | 10.23 | 9.78 |
| 10 to 14 | 10.7 | 10.19 |
| 15 to 19 | 11.08 | 10.55 |
| 20 to 24 | 11.6 | 11.1 |
| 25 to 29 | 11.35 | 10.84 |
| 30 to 34 | 11.84 | 11.47 |
| 35 to 39 | 11.3 | 10.97 |
| 40 to 44 | 10.82 | 10.61 |
| 45 to 49 | 9.84

U.s. Population Distribution By Age

Geography Teaching

Geoy Teaching is a term that refers to the use of geographic concepts, skills, and tools to enhance the teaching and learning of various subjects. Geoy Teaching can help students develop spatial thinking, critical thinking, problem-solving, and global awareness, as well as foster curiosity and appreciation for the natural and human world.
ome examples of Geoy Teaching are:

– Using maps, globes, atlases, and geographic information systems (GIS) to explore and analyze different places, regions, and phenomena.
– Incorporating fieldwork, citizen science, and outdoor learning activities to engage students with their local and global environment.
– Integrating geographic perspectives and themes, such as location, place, human-environment interaction, movement, and regions, into the curriculum of history, science, social studies, and other subjects.
– Applying geographic inquiry and skills, such as asking geographic questions, acquiring geographic information, organizing geographic information, analyzing geographic information, and answering geographic questions, to investigate and communicate about various issues and topics.
– Developing geographic literacy and competency, which is the ability to use geographic knowledge and skills to make informed decisions and take responsible actions in a complex and interconnected world.

Geoy Teaching is supported by various organizations and initiatives, such as Canadian Geographic Education, Governor’s Educator of the Year Program, and the National Geographic Society. These organizations provide resources, professional development, recognition, and funding for educators who want to implement Geoy Teaching in their classrooms.

Geoy Teaching is a valuable and innovative approach to education that can help students develop the knowledge, skills, and attitudes they need to succeed in the 21st century. Geoy Teaching can also foster a sense of wonder, curiosity, and respect for the diversity and beauty of our planet and its inhabitants.

Word count: 250

Geography Teaching

Crops For Carbon Farming

Carbon farming is a set of agricultural practices that aim to sequester carbon in the soil and vegetation, thereby reducing the amount of carbon dioxide in the atmosphere. The practice involves growing crops that absorb carbon from the air and store it in the soil. Carbon farming is an effective way to mitigate climate change, as it helps to reduce greenhouse gas emissions and improve soil health .

Regenerative farming is a type of carbon farming that focuses on improving soil health and sequestering carbon through unconventional techniques. These techniques include cover cropping, crop diversity, protecting watersheds, and integrating livestock into the farm system . Regenerative farming can help farmers reduce agricultural emissions while simultaneously improving soil health . The Canadian government has earmarked $270 million in its April 19 federal budget to support agriculture and climate-smart solutions, including regenerative farming .

Perennial crops are another type of crop that can be used for carbon farming. Perennial crops offer potential to sequester carbon when grown in multilayered systems. One system uses perennial staple crops that grow on trees that are analogs to maize and beans, or vines, palms and herbaceous perennials .

Here are some of the best crops for carbon sequestration :

1. Chestnuts: Chestnuts are a tree crop that can store high levels of carbon.
2. Walnuts: Walnuts are another crop that will store high levels of carbon.
3. Cobnuts: Cobnuts are a type of hazelnut that has been specifically bred for nut production.
4. Olives: Olives are a tree crop that can store carbon in the soil.
5. Apples: Apples are a tree crop that can store carbon in the soil.
6. Truffles: Truffles are a type of fungus that can store carbon in the soil.
7. Shiitake Mushrooms: Shiitake mushrooms are a type of fungus that can store carbon in the soil.
8. Perennial Vegetables: Perennial vegetables such as asparagus, rhubarb, and artichokes can store carbon in the soil.

In conclusion, carbon farming is an effective way to mitigate climate change, and regenerative farming and perennial crops are two types of carbon farming that can help to sequester carbon in the soil and vegetation. By adopting these practices, farmers can reduce agricultural emissions while simultaneously improving soil health ..

Crops For Carbon Farming

How To Draw Free Body Diagrams

A free-body diagram is a graphical representation of the forces acting on an object in a given situation. It can help us analyze the motion and equilibrium of the object, as well as the interactions with other bodies. Here is a brief guide on how to draw free-body diagrams in approximately 1000 words:

1. Sketch the situation. Draw a simple picture of the object and its surroundings, and identify the relevant forces that act on it. For example, if the object is a car on a slope, you might draw the car, the slope, the ground, and the forces of gravity, normal, friction, and tension (if there is a rope attached to the car).
2. Isolate the object. Draw a dot or a box to represent the object, and erase everything else. This is the free-body diagram of the object, and it shows only the forces that act directly on it. Do not include forces that act on other bodies, or forces that the object exerts on other bodies. For example, if the object is a car on a slope, you would erase the slope, the ground, and the rope, and only keep the dot or the box for the car.
3. Draw and label the forces. Draw arrows from the dot or the box to show the direction and magnitude of each force. The length of the arrow should be proportional to the strength of the force. Label each arrow with the type and symbol of the force, such as F_g for gravity, F_N for normal, F_f for friction, and F_T for tension. Use subscripts to indicate which bodies are involved in the force, such as F_N,car for

How To Draw Free Body Diagrams