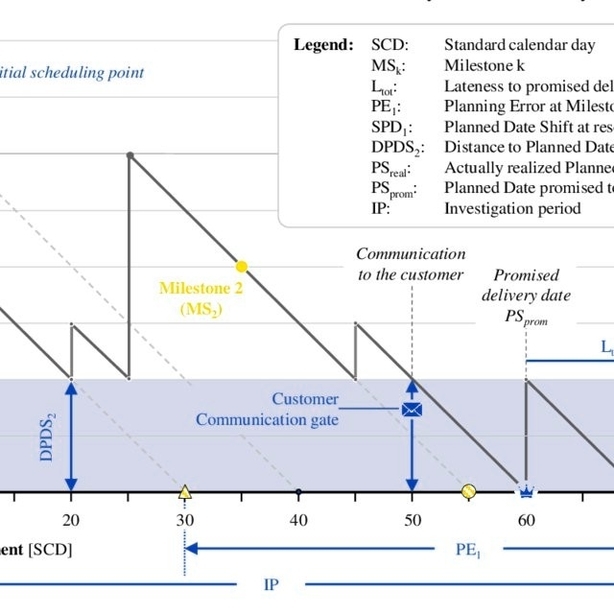
Milestone Trend Analysis (MTA) is a project management technique that helps project managers track the progress of their projects. It is a tool that enables the project team to visualize if the work corresponding to certain project milestones is ahead of, on, or behind schedule. MTA is one of the most used tools in controlling the project schedule .
To use MTA, we need a project schedule including its related milestone plan first. At the beginning of the implementation phase, we ask the team members responsible for the milestones for their planning status. We then present the results as an MTA chart on our project management dashboard. The vertical axis of the chart is called the “planning line.” If we start the project on time, we can tick off the first milestone, Project Start. By the end of the first month into the implementation phase, we ask the team members responsible for the milestones M1 to M4 for their best guesses when these milestones could be reached. We then obtain a monthly status of the trend of our project milestones by following that routine .
MTA charts can help project managers assess the health of a project and provide valuable insights about scheduling or scope for future initiatives . By looking at the milestone trend analysis chart, stakeholders can understand the direction the project is heading in and take remedial actions if required . MTA visualizes the defined milestones from the start to the planned finish date. The horizontal axis is divided into reporting dates, for example weeks or months .
In case the trend for one particular milestone points upward, we shall analyze the situation together with the experts of the work packages which contribute to that milestone, and decide on actions in order to achieve a horizontal trend, or maybe even one that points downwards. Only if we enter that analysis we turn our milestone trend indicator into a real “milestone trend analysis” tool .
In summary, MTA is a useful tool for project managers to track the progress of their projects. It helps the project team to visualize if the work corresponding to certain project milestones is ahead of, on, or behind schedule. MTA charts can help project managers assess the health of a project and provide valuable insights about scheduling or scope for future initiatives. By looking at the milestone trend analysis chart, stakeholders can understand
