Biogas Diagram – Bio Gas Chart – Biogas system – Biofuel diagram. Biogas creates benefits for Ecosystem, Decreases deforestation, reuses waste, less smoke, production of organic compost, healthier foods. Source: PSU https://ygraph.com/chart/2088
Love – Love Diagram – Love Chart – Love
Love – Love Diagram – Love Chart – Love Visual – Love Image – Love Heart – What is true love? Love, Sex, Friendship. Commitment, intimacy, friendship, romance, true love, lust. Diagram showing how to be in love and how to have a meaningful relationship. What is true love Source: Myspace love diagram
Love – Love Diagram – Love Chart – Love
Love Symptoms – Love Chemicals – Chemica
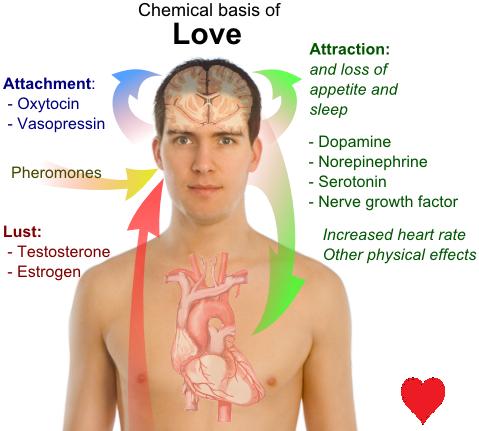
Love Symptoms – Love Chemicals – Chemical of Love – Love Chart How do you know if you are in love? Am I in love? Diagram showing symptoms of love: loss of appetite, sleep, increased heart rate, testerone, estrogen. Physical effects of love. Source: prostheticknowledge https://ygraph.com/chart/2090
Love Symptoms – Love Chemicals – Chemica
Project Management Diagram – Project Man
Project Management Diagram – Project Management Chart – Quality, Time, Cost, Scope are the 4 fundamental parts of any project. Project Manager (PM) must balance time, cost and scope to provide quality required by stakeholders and project sponsors. Source: Mezzmedia https://ygraph.com/chart/2092
Project Management Diagram – Project Man
Project Management – Project Management
Project Management – Project Management Approach – Project Management Steps – Project Management Phases – Phased Approach – Project Management Cycle: Iniatiation, Planning and Design, Executing, Monitoring and Controlling, Closing. PMP, PMI, PMO. Source: Wikipedia https://ygraph.com/chart/2091
Project Management – Project Management
Smart Goals – S.M.A.R.T. goals – SMART G
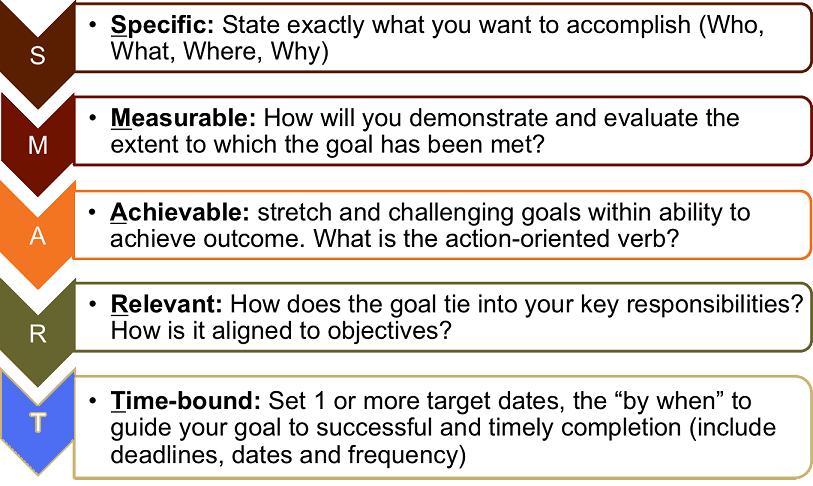
Smart Goals – S.M.A.R.T. goals – SMART Goals Framework – Smart, Measurable, Assignable, Realistic, Time-Based Goals – s.m.a.r.t. goals model. What are smart goals? Source: PennState https://ygraph.com/chart/2093
Smart Goals – S.M.A.R.T. goals – SMART G
SMART Model for Setting Goals. Setting
SMART Model for Setting Goals. Setting Goals theory. S.M.A.R.T. model (s.m.a.r.t. framework). Smart goal example. Smart Goals describe what is to be accomplished; concrete statements about deliverables, outcomes and timeframes. Source: InsideGood https://ygraph.com/chart/2094
SMART Model for Setting Goals. Setting
Meter to Feet Conversion. Metric Chart.
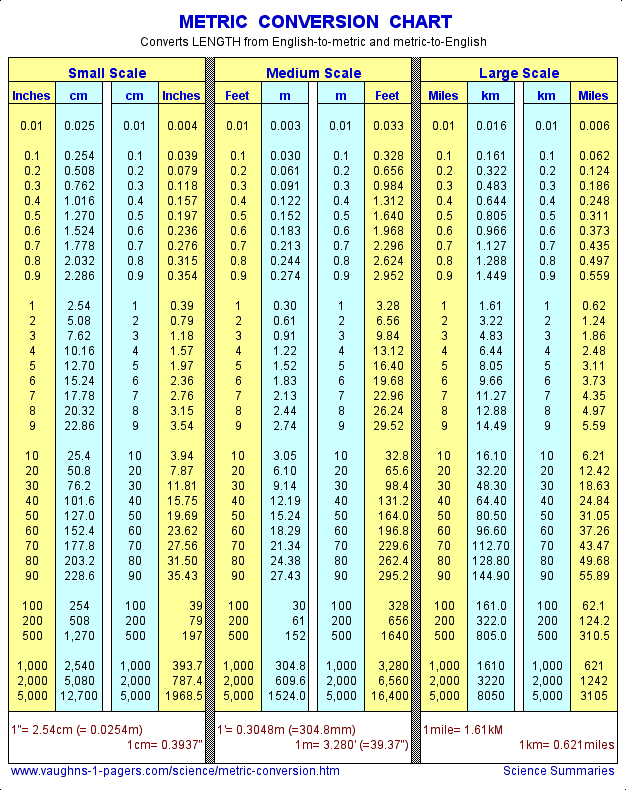
Meter to Feet Conversion. Metric Chart. Meter Conversion Table. How to convert meters to feet and inches. Meters in feet, inches. How many cm is in meter? Meter Conversion Chart. Convert Meters to Feet Chart. Inches, feet, miles conversion to cm, meters, km. Metric Conversion Chart. Printable. Source: Vaughns-1-pagers meter conversion chart
Meter to Feet Conversion. Metric Chart.
Debt Refinancing – Debt Refinancing Diag
Debt Refinancing – Debt Refinancing Diagram – Debt Consolidation Chart – Loan Consolidation Diagram – Credit Card Debt Consolidation Model – Credit Line Refinancing. Business or individual with multiple loans or credit cards transfers all debts to a single lender and then pays lower monthly payments to this lender. Debt consolidation works but has a negative effect on credit history. Source: Startup Loans https://ygraph.com/chart/2292
Debt Refinancing – Debt Refinancing Diag
Graph Quadrants. Cartesian Plane. 1) Id
Graph Quadrants. Cartesian Plane. 1) Identify axes, graph quadrants and origin. 2) Examine ordered pairs. Each point is an ordered pair consisting of x and y coordinates. Source: http://fym.la.asu.edu/~tturner/MAT_117_online/Cartesian_plane/Cartesian_Plane.htm https://ygraph.com/chart/695