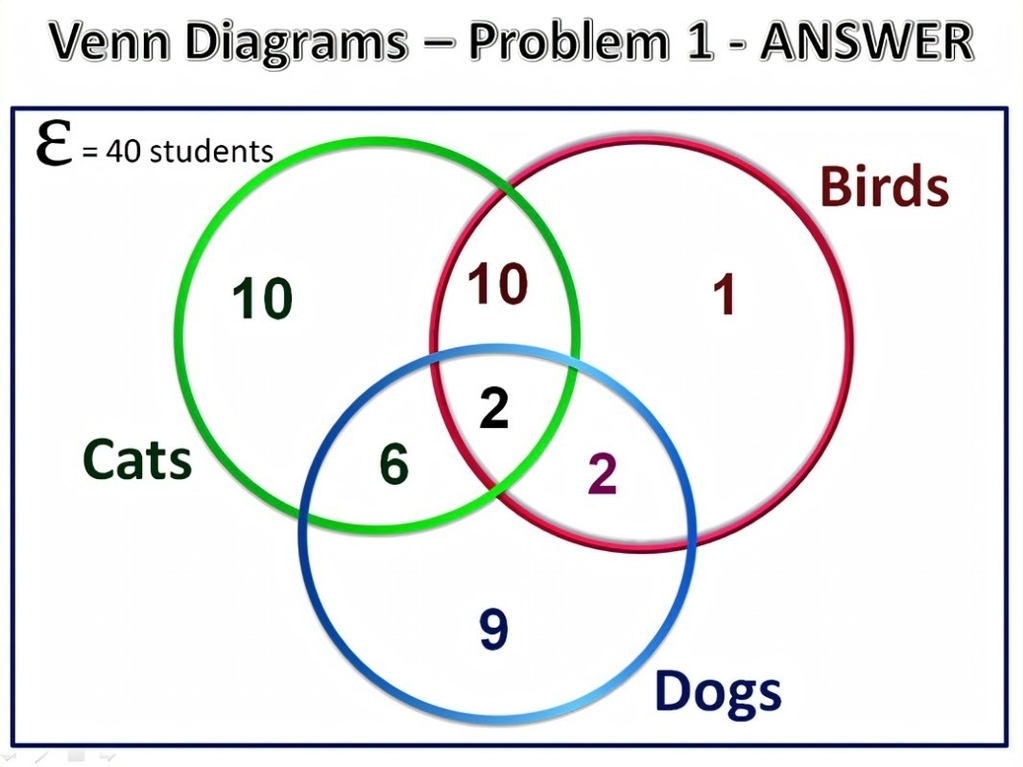
A Venn diagram is a graphical representation of the relationships between different sets of data. A three-circle Venn diagram is a type of Venn diagram that is used to compare and contrast three different categories. Each circle in the diagram represents a different category, and the overlapping regions between the circles represent properties that are shared between the categories.
To create a three-circle Venn diagram, you can start by drawing three circles that overlap in the center. Each circle represents a different category, and the overlapping regions between the circles represent properties that are shared between the categories. For example, if you were creating a three-circle Venn diagram to compare and contrast dogs, cats, and birds, you could draw a circle for dogs, a circle for cats, and a circle for birds. The overlapping regions between the circles would represent properties that are shared between the categories, such as the fact that all three animals have claws.
Three-circle Venn diagrams can be used to compare and contrast a wide range of different categories. For example, they can be used to compare and contrast different types of food, different types of music, or different types of sports. They can also be used to compare and contrast different groups of people, such as different age groups or different genders.
When creating a three-circle Venn diagram, it is important to keep in mind that the diagram is only a representation of the relationships between the different categories. It is not a substitute for a detailed analysis of the data. However, it can be a useful tool for organizing and visualizing data, and for identifying patterns and relationships between different categories.
In conclusion, a three-circle Venn diagram is a type of Venn diagram that is used to compare and contrast three different categories. Each circle in the diagram represents a different category, and the overlapping regions between the circles represent properties that are shared between the categories. Three-circle Venn diagrams can be used to compare and contrast a wide range of different categories, and can be a useful tool for organizing and visualizing data. .
