Germany GDP PPP

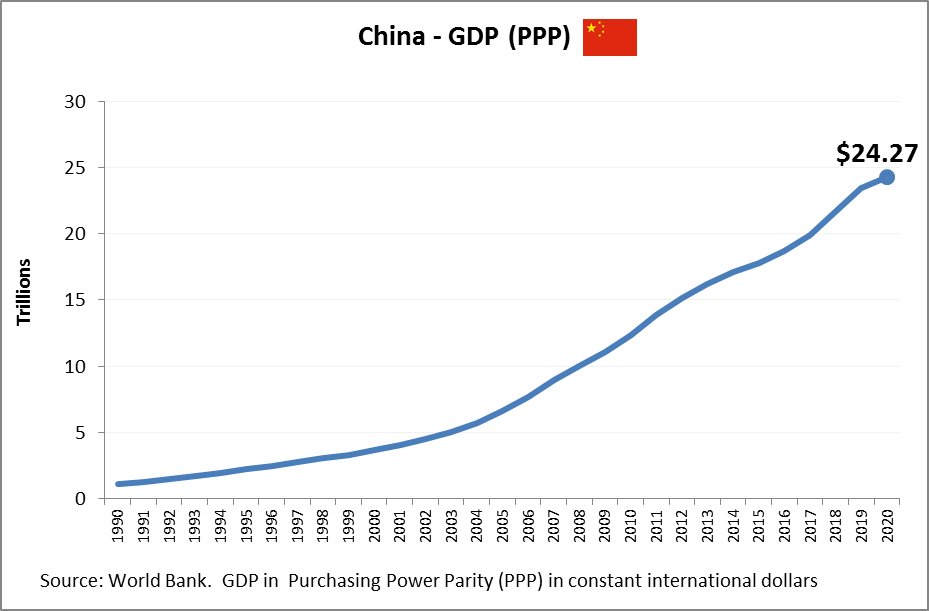
Germany economy size measured in Power Purchasing Parity, i.e. comparing relative standard of living and ability to afford goods and services. Germany’s Gross Domestic Product (GDP) chart showing historical economic growth as measured in PPP international dollars.

Germany GDP PPP

Canada GDP PPP

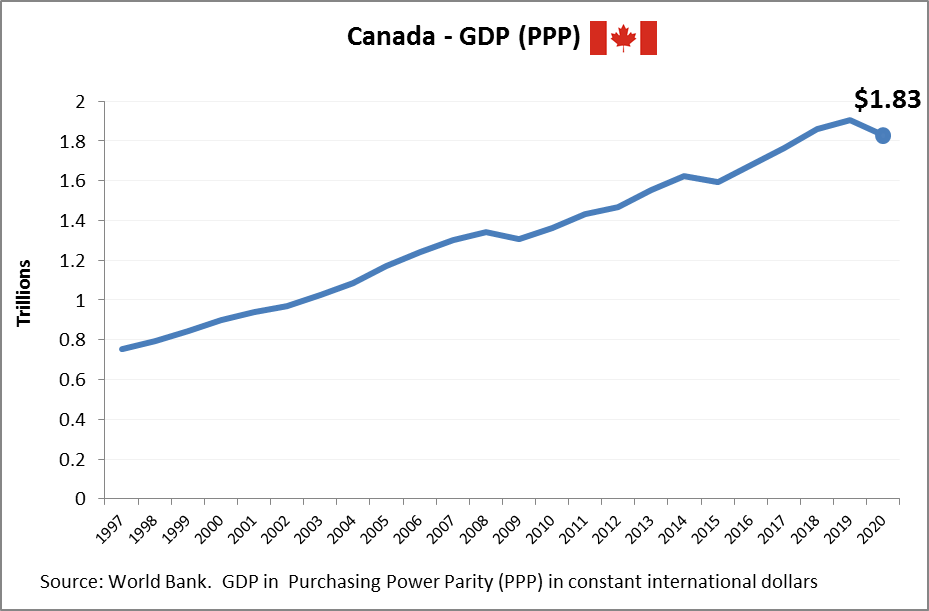
Canada economy size measured in Power Purchasing Parity, i.e. comparing relative standard of living and ability to afford goods and services. Canada’s Gross Domestic Product (GDP) chart showing historical economic growth as measured in PPP international dollars.

Canada GDP PPP

Countries by GDP 2020 – List of countrie

Countries by GDP 2020 – List of countries by their Gross Domestic Product. World economies by size in Nominal terms in US Dollars. The below chart shows top economies in 2020. US is still a number one economy closely followed by China. The same trends are set to continue in 2021. countries by gdp

Countries by GDP 2020 – List of countrie

Household Income Chart. Household Incom

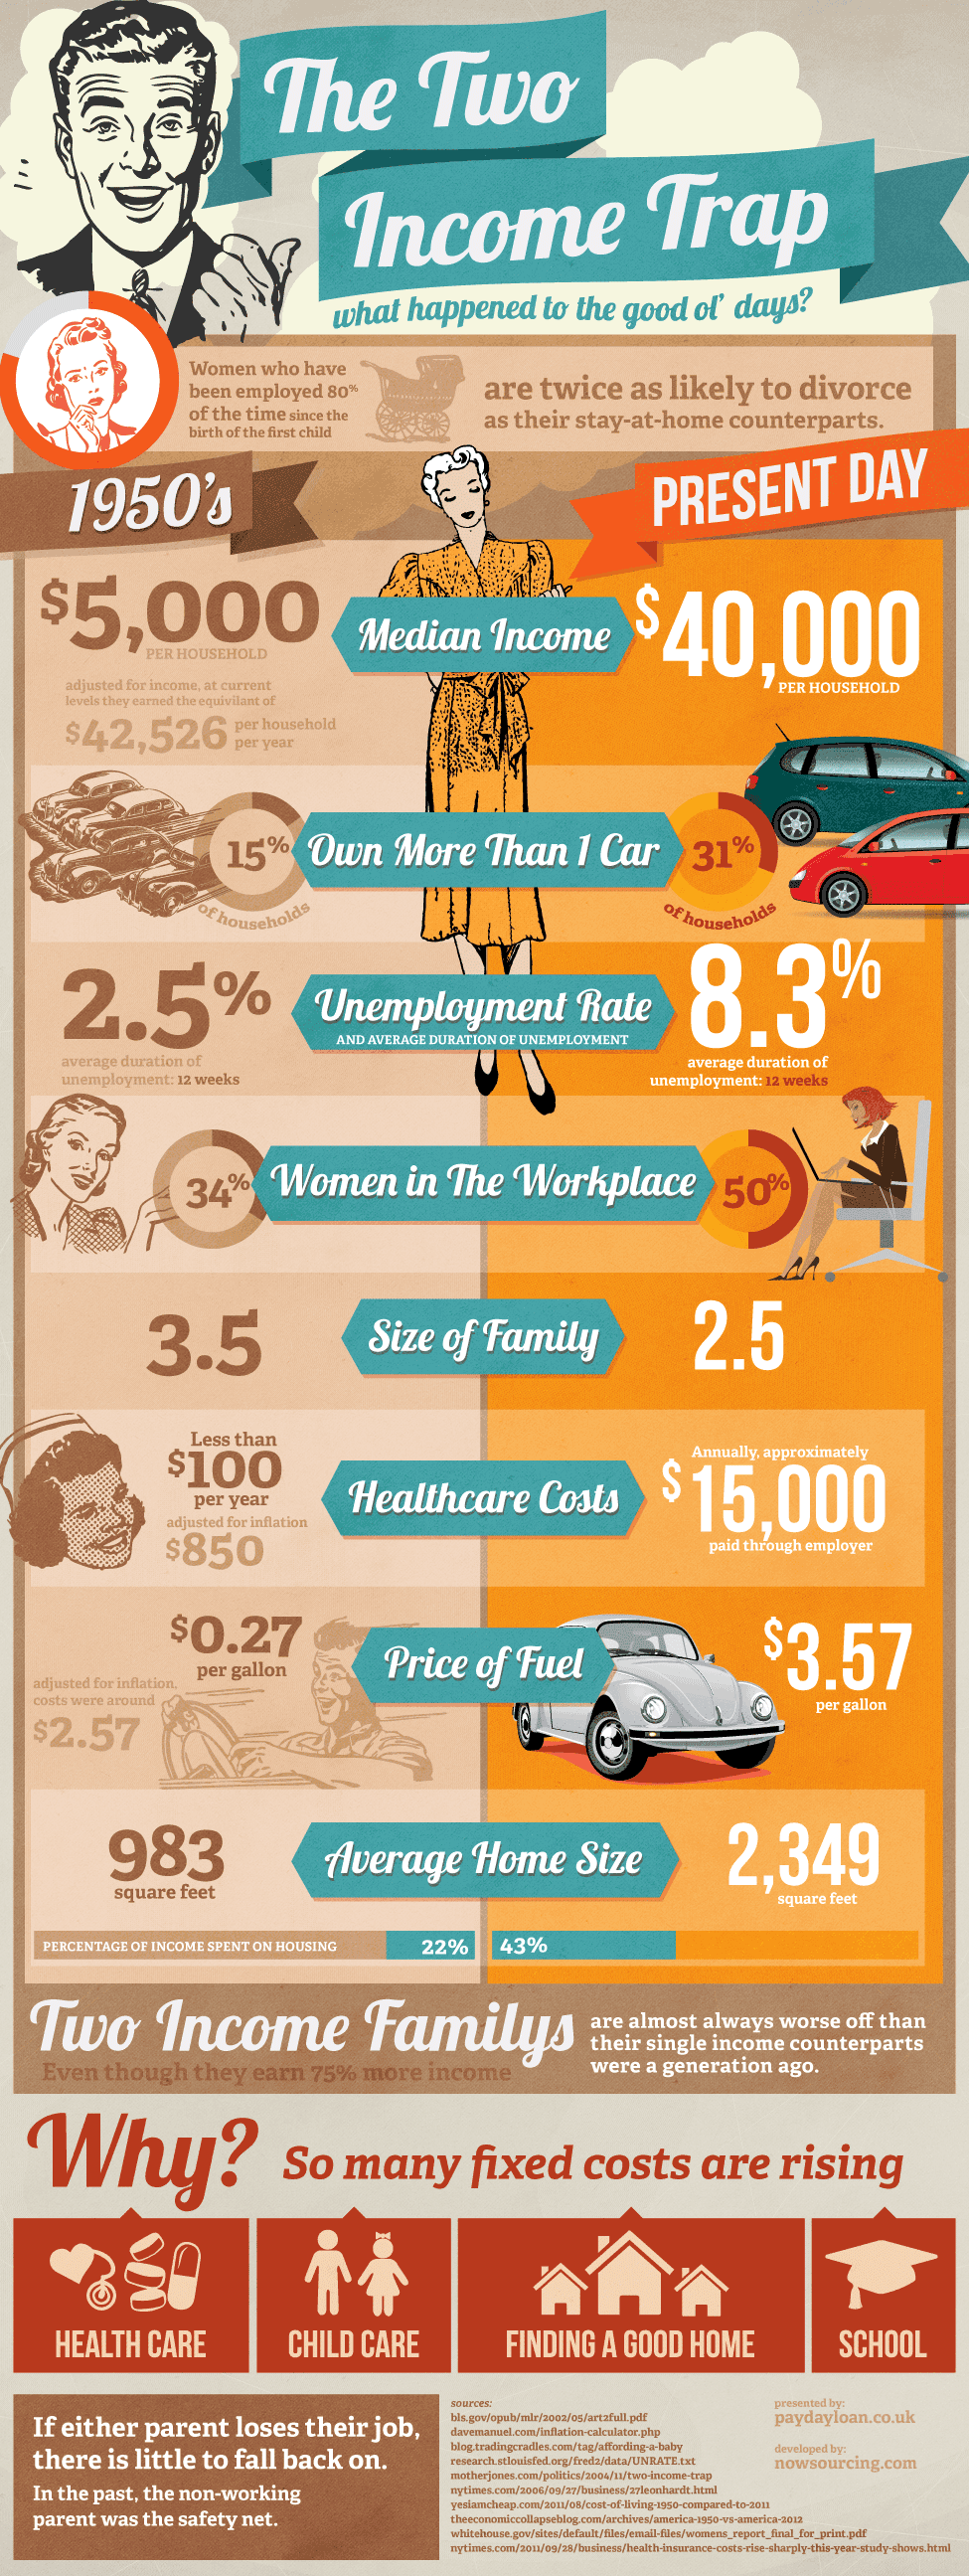
Household Income Chart. Household Income Diagram. USA Income Comparison 1950s to Present Day. Median Income Chart. Own More than 1 car chart. Unemployment Rate Chart. Income Trap Infographic. Women in the Workplace Chart. Size of Family Chart. Healthcare Costs Chart Comparison. Price of Fuel Chart. Average home size chart. Household income as compared to previous generation. Percentage of income spent on housing has increased. Source: http://www.paydayloan.co.uk/Visual-News/the-two-income-trap.html https://ygraph.com/chart/2508

Household Income Chart. Household Incom

How Has Dodd-Frank Impacted Your Checkin

How Has Dodd-Frank Impacted Your Checking Account? Dodd-Frank Diagram. Checking Account Chart. How Dodd-Frank government policy impacts your bank account. Increased Regulatory Costs and Bank Fees chart. Banks ended Free Checking accounts, increased monthly fees. This resulted in lost revenues for the banks. Checking Account Chart. dodd frank

How Has Dodd-Frank Impacted Your Checkin

Economics of Marriage and Divorce. Marri

Economics of Marriage and Divorce. Marriage Chart vs. Divorce Chart. Marriage Diagram showing the benefits of marriage and costs of divorce. Benefits of Marriage. Married Parents vs. Single Parent Diagram. Percentage of Births Graph. Graph showing births occurring outside of marriage. Percentage of Household Income Groups Graph. Marriage vs. Time Graph. Next Generation Diagram. Income Chart. Long Term Financial Decisions last for generations. Source: http://www.paydayloan.co.uk/Visual-News/the-economics-of-marriage-and-divorce.html https://ygraph.com/chart/2445

Economics of Marriage and Divorce. Marri

Summer Chart. Impact of Summer on Econo

Summer Chart. Impact of Summer on Economy. Summer Time and Economy Chart. Drought Map USA. Summer Electricity Price Increase. Average Retail Prices of Electricity Chart. Impact on Agriculture of hot summers infographic. More car accidents in the summer and therefore more insurance claims. Gas price chart. Gas prices growth in summer. Fuel price summer. Summer impact on infrastructure. Nuclear Plants work during summer chart. Source: http://www.clicksoftware.com/national-critical-planning-infrastructure-management-during-summer.htm#.UDzN8kL3DoA https://ygraph.com/chart/2451

Summer Chart. Impact of Summer on Econo

Percentage of Poor Graph. Poverty Line

Percentage of Poor Graph. Poverty Line Graph. Number of Poor People in America. USA Poverty Chart. USA Poor Demographics. Demographics of Poverty in US. What makes people poor? Reasons for being poor chart: no education, addictions, never saving money, borrowing too much, lowing paying jobs, no work at all. Escaping poverty chart. Poor People Chart . Poverty Infographic. Poverty Diagram. Use of Payday loans. Source: http://www.paydayloan.co.uk/Visual-News/the-invisible-poor.html https://ygraph.com/chart/2453

Percentage of Poor Graph. Poverty Line