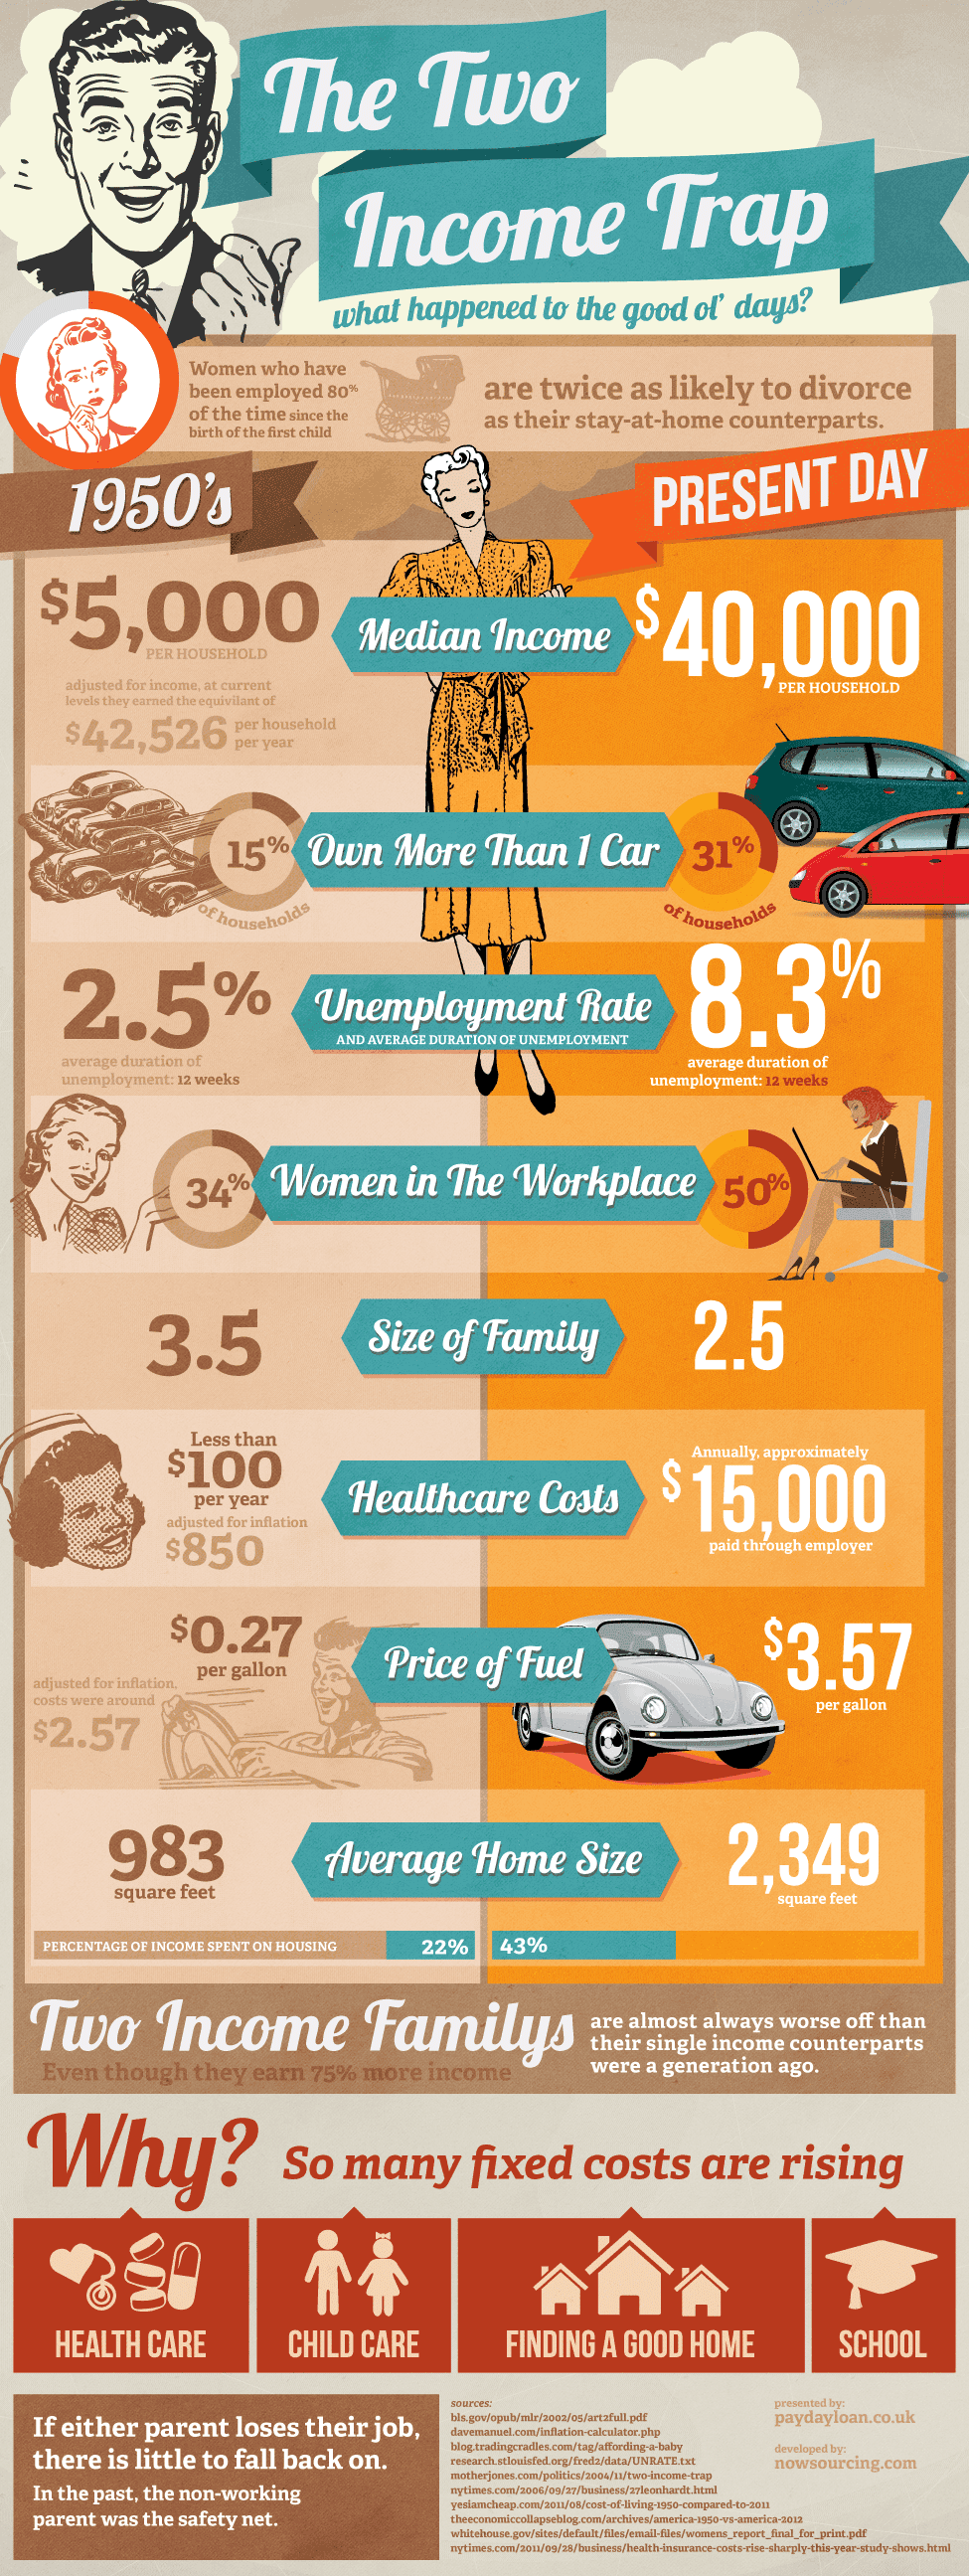
Household Income Chart. Household Income Diagram. USA Income Comparison 1950s to Present Day. Median Income Chart. Own More than 1 car chart. Unemployment Rate Chart. Income Trap Infographic. Women in the Workplace Chart. Size of Family Chart. Healthcare Costs Chart Comparison. Price of Fuel Chart. Average home size chart. Household income as compared to previous generation. Percentage of income spent on housing has increased. Source: http://www.paydayloan.co.uk/Visual-News/the-two-income-trap.html https://ygraph.com/chart/2508
Household Income Chart. Household Incom

