Japan GDP PPP

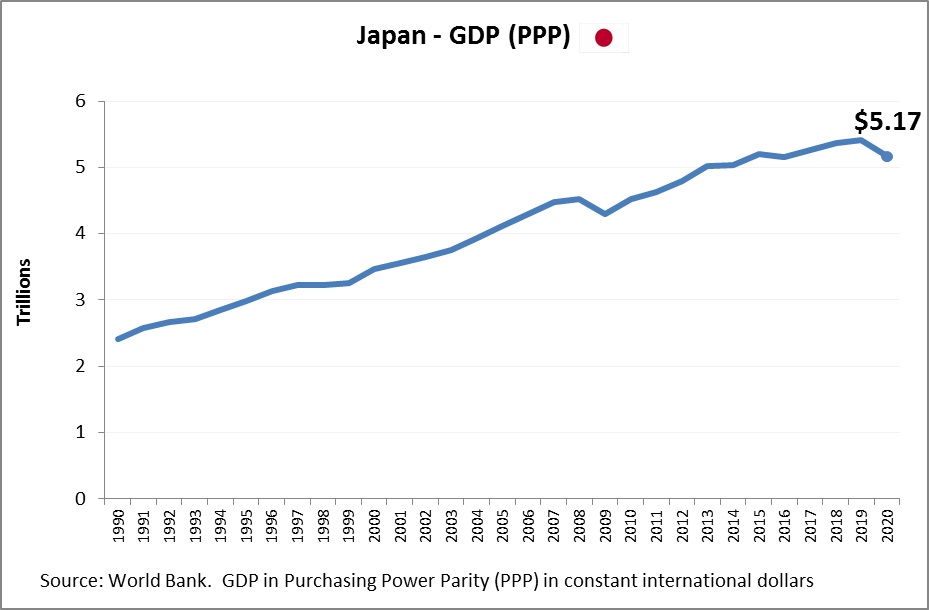
Japan economy size measured in Power Purchasing Parity, i.e. comparing relative standard of living and ability to afford goods and services. Japan’s Gross Domestic Product (GDP) chart showing historical economic growth as measured in PPP international dollars.

Japan: Japan holds one of the highest overall GDP PPP rankings globally, a reflection of its highly advanced, technology-driven economy and substantial domestic market. Although its population has been declining, Japan maintains strong economic output through high productivity, innovation in sectors like robotics and electronics, and a solid export base. GDP PPP per capita is also high, showcasing the country’s well-developed infrastructure, high life expectancy, and quality public services. However, long-term economic pressures from demographic aging and deflation persist, even as Japan continues to maintain a very high standard of living.

Japan GDP PPP

Italy GDP PPP

Italy economy size measured in Power Purchasing Parity, i.e. comparing relative standard of living and ability to afford goods and services. Italy’s Gross Domestic Product (GDP) chart showing historical economic growth as measured in PPP international dollars.

Italy: Italy’s GDP PPP reflects the strength of a diversified industrial economy within the Eurozone, marked by a mix of advanced manufacturing, fashion, tourism, and agriculture. While its overall GDP PPP is sizable, placing it among the world’s top economies, it’s somewhat constrained by slow growth and structural inefficiencies. Per capita GDP PPP is relatively high, indicating a decent standard of living and strong infrastructure, though it’s slightly below the EU’s top-tier economies. Italy’s regional disparities — with a wealthier north and a less developed south — are evident in per capita figures and remain a challenge to balanced economic development.

Italy GDP PPP

Mexico GDP PPP

Mexico economy size measured in Power Purchasing Parity, i.e. comparing relative standard of living and ability to afford goods and services. Mexico’s Gross Domestic Product (GDP) chart showing historical economic growth as measured in PPP international dollars.

Mexico: Mexico’s GDP PPP is among the largest in Latin America, thanks to its large population, rich natural resources, and close economic ties with the United States. Its total PPP-adjusted GDP is boosted by a robust manufacturing sector, especially automotive and electronics, and growing services. However, GDP PPP per capita is moderate, reflecting persistent income inequality, informal labor markets, and regional economic gaps. Despite these issues, Mexico’s middle class is expanding, and structural reforms along with trade integration under USMCA continue to support economic modernization and per capita growth.

Mexico GDP PPP

Indonesia GDP PPP

Indonesia economy size measured in Power Purchasing Parity, i.e. comparing relative standard of living and ability to afford goods and services. Indonesia’s Gross Domestic Product (GDP) chart showing historical economic growth as measured in PPP international dollars.

Indonesia: Indonesia’s overall GDP PPP positions it as a major player among emerging markets, underpinned by a large population and diverse economy spanning manufacturing, services, and resource extraction. Its GDP PPP is among the highest in Southeast Asia, showing strong aggregate output. However, per capita GDP PPP is still relatively low, reflecting the country’s development status and the income gap across its many islands and regions. Despite this, Indonesia is progressing steadily, with growing urbanization, increased digital connectivity, and structural reforms supporting improvements in living standards and economic inclusiveness.

Indonesia GDP PPP

Australia GDP PPP

Australia economy size measured in Power Purchasing Parity, i.e. comparing relative standard of living and ability to afford goods and services. Australia’s Gross Domestic Product (GDP) chart showing historical economic growth as measured in PPP international dollars.

Australia: Australia’s GDP based on Purchasing Power Parity reflects a highly developed, resource-rich economy that combines significant natural exports with a service-driven domestic market. In terms of overall PPP-adjusted GDP, Australia ranks relatively high given its smaller population, demonstrating its economic strength on the global stage. However, it truly stands out in GDP PPP per capita, which is among the highest in the world. This high per capita value indicates a strong standard of living, widespread access to goods and services, and a well-distributed economic output across its population. Australia’s economic performance is driven by sectors like mining, finance, and education, with substantial exports to Asia, particularly China.

Australia GDP PPP

United Kingdom GDP PPP

United Kingdom economy size measured in Power Purchasing Parity, i.e. comparing relative standard of living and ability to afford goods and services. United Kingdom’s Gross Domestic Product (GDP) chart showing historical economic growth as measured in PPP international dollars.

United Kingdom: The United Kingdom’s GDP PPP remains high, positioning it among the top global economies. With strengths in finance, technology, pharmaceuticals, and creative industries, the UK maintains a significant total output despite its smaller population compared to some economic rivals. Its per capita GDP PPP is also very high, indicating a wealthy, developed nation with high consumer purchasing power. Post-Brexit adjustments have introduced new challenges, but the country continues to benefit from strong institutions, a global business presence, and a highly skilled workforce.

United Kingdom GDP PPP

Brazil GDP PPP

Brazil economy size measured in Power Purchasing Parity, i.e. comparing relative standard of living and ability to afford goods and services. Brazil’s Gross Domestic Product (GDP) chart showing historical economic growth as measured in PPP international dollars.

Brazil: Brazil’s GDP PPP reflects the scale and diversity of Latin America’s largest economy, bolstered by a broad mix of agriculture, mining, energy, and manufacturing. On a global scale, Brazil has a high overall GDP PPP, ranking in the top ten, primarily due to its large population and abundant natural resources. However, the per capita GDP PPP tells a more modest story, highlighting persistent issues with income inequality, social disparity, and uneven regional development. Despite these challenges, Brazil remains a key emerging market, with significant potential tied to infrastructure development and demographic advantages.

Brazil GDP PPP

EU GDP PPP

European Union (EU) economy size measured in Power Purchasing Parity, i.e. comparing relative standard of living and ability to afford goods and services among countries. EU’s Gross Domestic Product (GDP) chart showing historical economic growth as measured in PPP international dollars.

EU: The European Union, when considered as a single economic entity, has one of the highest GDP PPP figures globally, thanks to the combined output of 27 member states. This collective economic power reflects a highly developed region with robust industrial bases, strong financial sectors, and significant technological innovation. Per capita GDP PPP across the EU varies widely, from wealthy nations like Luxembourg and Germany to lower-income members such as Bulgaria and Romania. On average, the EU maintains a high per capita GDP PPP, representing one of the world’s most prosperous regions, though internal disparities remain a critical policy concern.

EU GDP PPP

Russia GDP PPP

Russia economy size measured in Power Purchasing Parity, i.e. comparing relative standard of living and ability to afford goods and services. Russia’s Gross Domestic Product (GDP) chart showing historical economic growth as measured in PPP international dollars.

Russia: Russia’s GDP PPP ranks within the top ten globally, driven heavily by its vast natural resource base, particularly oil and gas. The PPP metric significantly increases Russia’s economic size compared to nominal figures, showing the lower domestic cost of living and the scale of internal consumption. However, per capita GDP PPP, while higher than many developing countries, is modest compared to Western economies, highlighting the limitations of a resource-dependent model and challenges with diversification. Geopolitical tensions and sanctions also affect economic performance, though domestic spending power remains relatively stable in PPP terms.

Russia GDP PPP

India GDP PPP

India economy size measured in Power Purchasing Parity, i.e. comparing relative standard of living and ability to afford goods and services. India’s Gross Domestic Product (GDP) chart showing historical economic growth as measured in PPP international dollars.

India: India ranks among the top economies globally in terms of overall GDP PPP, reflecting its large and rapidly growing population. The PPP adjustment highlights the strength of India’s domestic economy, which is driven by services, agriculture, and a burgeoning technology sector. However, per capita GDP PPP remains relatively low, indicating that while the economy is large, individual income and consumption levels are modest compared to developed countries. Nevertheless, India’s expanding middle class, infrastructure investments, and digital transformation present significant opportunities for future per capita growth.

India GDP PPP