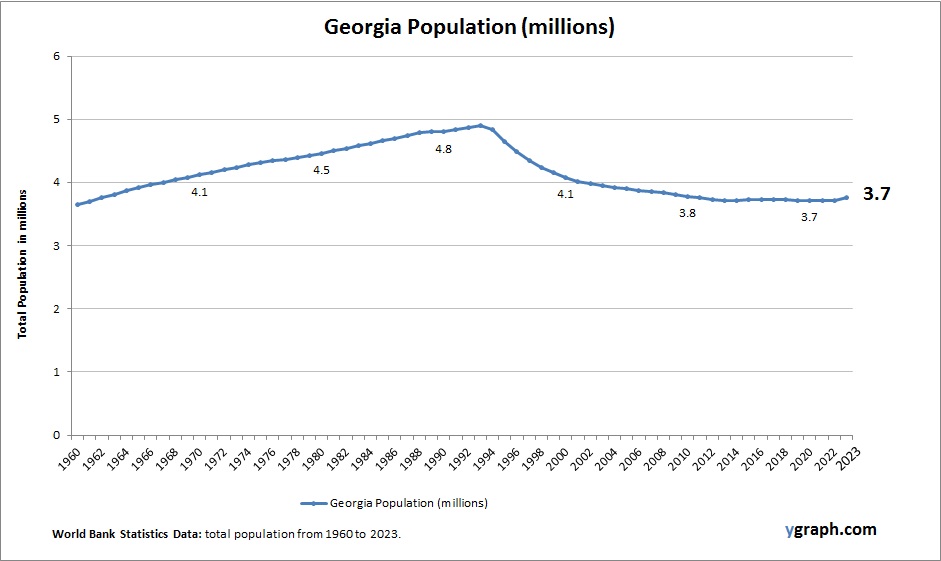
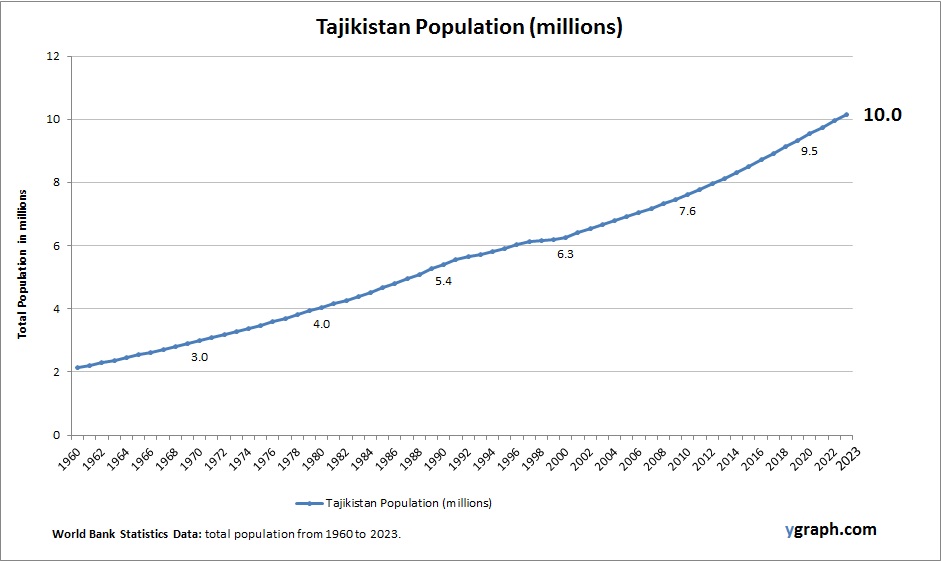
Bangladesh Births per woman

This diagram presents Bangladesh Births per woman. The fertility rate statistics are compiled by World Bank. Based on the latest demographics info provided for Bangladesh.

Bangladesh has seen a dramatic decline in fertility over the past decades, thanks to strong family planning programs, education, and healthcare access. While rural areas still have higher fertility, national trends reflect continued movement toward replacement-level birth rates.

Bangladesh Births per woman

Malawi Births per woman

Chart above demonstrates Malawi Births per woman. The fertility rate statistics are compiled by World Bank. Based on the latest demographics info provided for Malawi.

Malawi maintains a high fertility rate, driven by strong cultural expectations around family size and limited access to modern contraceptives, especially in rural areas. Despite government and NGO efforts to improve reproductive health services, barriers remain in education and healthcare delivery. Rapid population growth continues to strain resources such as schools, healthcare facilities, and employment markets. Child mortality rates have decreased due to improved healthcare, but sustaining this progress requires expanded family planning and economic development. The young demographic presents both challenges and opportunities for Malawi’s future.

Malawi Births per woman

French Polynesia Births per woman

The above graph shows French Polynesia Births per woman. World Bank is the source of this birth data. Latest births per woman information for French Polynesia.

French Polynesia has a moderate fertility rate, with women typically having two to three children. The birth rate has declined over recent decades, especially in urbanized areas like Tahiti. Cultural shifts and access to reproductive healthcare have contributed to this trend, although traditional values still play a role in family planning decisions.

French Polynesia Births per woman

Vietnam Births per woman

This diagram presents Vietnam Births per woman. This is according to World Bank birth stats by country. Latest births per woman information for Vietnam.

Vietnam has a relatively low fertility rate, influenced by long-standing population policies and rapid economic development. Urbanization, improved healthcare, and education have supported smaller families, though regional differences remain between rural and urban areas.

Vietnam Births per woman

India Population

The above graph shows India Population. The country statistics are compiled by World Bank. Latest population information for India.

India is the second most populous country globally, with a large and youthful population. Rapid population growth has slowed due to declining fertility rates but remains substantial due to the base population size. Urbanization, economic development, and improvements in health and education continue to shape demographic trends, with regional variations influencing policy and planning.

India Population

Heavily indebted poor countries (HIPC) Population

This diagram presents Heavily indebted poor countries (HIPC) Population. World Bank is the source of this population data. Based on the latest available information for Heavily indebted poor countries (HIPC).

HIPC countries often experience high population growth driven by elevated fertility rates and youthful demographics. Development challenges such as limited access to healthcare, education, and employment impact demographic structures and long-term population planning.

Heavily indebted poor countries (HIPC) Population

Uzbekistan Population

The above graph shows Uzbekistan Population. The country statistics are compiled by World Bank. Based on the latest demographics info provided for Uzbekistan.

Uzbekistan has a large and youthful population experiencing moderate growth. Fertility rates have declined but remain above replacement level, supported by improved healthcare and education. Urbanization is progressing rapidly, especially in cities like Tashkent, while rural areas maintain traditional family structures. The country’s economic diversification and regional migration trends influence demographic shifts and social development.

Uzbekistan Population

El Salvador Population

The above graph shows El Salvador Population. World Bank is the source of this population data. Latest population information for El Salvador.

El Salvador’s population growth has slowed in recent years due to declining fertility and significant emigration. Urbanization and economic pressures have led to smaller families, with remittances from abroad playing a major role in the country’s economy and demographics.

El Salvador Population

Iraq Births per woman

The above graph shows Iraq Births per woman. This is according to World Bank birth stats by country. Based on the latest available information for Iraq.

Iraq’s fertility rate remains relatively high, although it has gradually declined due to urbanization, conflict, and changing social norms. The country’s young population faces challenges in education, healthcare, and employment, while political instability and displacement impact demographic patterns. Efforts to improve reproductive health and family planning are ongoing amid rebuilding and development initiatives.

Iraq Births per woman

Suriname Population

This diagram presents Suriname Population. The country statistics are compiled by World Bank. Latest population information for Suriname.

Suriname has a small and diverse population that grows slowly, influenced by moderate fertility rates and migration patterns. The country’s population is concentrated primarily in urban areas along the coast, with interior regions sparsely populated. Economic activities such as mining and agriculture shape demographic distribution. Suriname’s multicultural society also reflects in its demographic characteristics and social dynamics.

Suriname Population