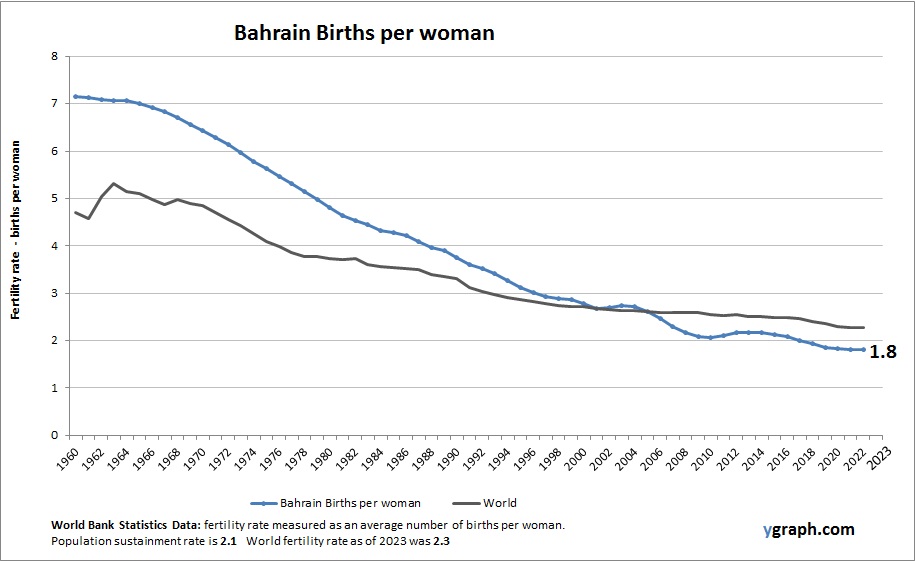
Equatorial Guinea Population

Chart above demonstrates Equatorial Guinea Population. World Bank is the source of this population data. Based on the latest demographics info provided for Equatorial Guinea.

Equatorial Guinea has a small but growing population characterized by high fertility rates and a youthful age structure. Economic wealth from oil has fueled urban growth, particularly in the capital Malabo, but demographic challenges include uneven access to healthcare and infrastructure outside urban centers.

Equatorial Guinea Population

Ukraine Population

The above graph shows Ukraine Population. The country statistics are compiled by World Bank. Based on the latest available information for Ukraine.

Ukraine’s population has been shrinking due to low fertility, high mortality, and significant emigration, especially among younger cohorts. The war and ongoing economic instability have accelerated these trends. The population is aging rapidly, and the demographic outlook poses serious challenges for reconstruction, labor force planning, and healthcare systems.

Ukraine Population

Guyana Births per woman

Chart above demonstrates Guyana Births per woman. This is according to World Bank birth stats by country. Based on the latest demographics info provided for Guyana.

Guyana’s fertility rate has been gradually declining as urbanization increases and education improves, although rural areas maintain higher birth rates. The country’s ethnically diverse population experiences varying demographic patterns, with migration also influencing population size and structure. Economic challenges and development initiatives affect reproductive health access.

Guyana Births per woman

North America Population

This diagram presents North America Population. The country statistics are compiled by World Bank. Latest population information for North America.

North America’s population is diverse and steadily increasing, driven by relatively higher fertility rates in some areas and strong immigration flows. The demographic structure varies widely, from aging populations in Canada to younger, growing populations in parts of the United States and Mexico.

North America Population

North America Births per woman

This diagram presents North America Births per woman. This is according to World Bank birth stats by country. Latest births per woman information for North America.

North America experiences moderate fertility rates overall, with significant variation among different ethnic and socioeconomic groups. Factors such as urbanization, education, healthcare access, and cultural diversity influence birth rates. Immigration sustains population growth, while many native-born populations exhibit below-replacement fertility. Demographic trends shape policy debates around healthcare, education, and workforce development.

North America Births per woman

New Zealand Population

The above graph shows New Zealand Population. This is according to World Bank total population stats. Latest population information for New Zealand.

New Zealand’s population continues to grow, largely supported by immigration, as fertility rates have declined below replacement level. The country’s demographic profile reflects an aging population, with strong multicultural influences shaping societal and economic development.

New Zealand Population

Nauru Births per woman

Chart above demonstrates Nauru Births per woman. World Bank is the source of this birth data. Latest births per woman information for Nauru.

Nauru has a moderately high fertility rate, influenced by cultural traditions and relatively limited access to family planning services. As a small island nation, its population dynamics are sensitive to migration and economic fluctuations, with community ties playing an important role in family size decisions.

Nauru Births per woman

Slovenia Births per woman

This diagram presents Slovenia Births per woman. This is according to World Bank birth stats by country. Based on the latest available information for Slovenia.

Slovenia has a low fertility rate, typical of many European Union countries. Women are having fewer children, often later in life, due to career considerations and economic factors. The government has implemented family-friendly policies to encourage childbirth, but demographic aging remains a key issue.

Slovenia Births per woman

Norway Population

This diagram presents Norway Population. World Bank is the source of this population data. Based on the latest available information for Norway.

Norway has a stable population with slow growth supported by immigration and moderate fertility rates. The country’s strong welfare system and high living standards contribute to a balanced demographic profile with a significant urban population.

Norway Population

Panama Births per woman

The above graph shows Panama Births per woman. World Bank is the source of this birth data. Based on the latest available information for Panama.

Panama has a moderate and declining fertility rate as it continues its demographic transition. Improved education, healthcare access, and urbanization contribute to smaller family sizes. The country maintains a relatively young population but is beginning to experience the early stages of aging.

Panama Births per woman