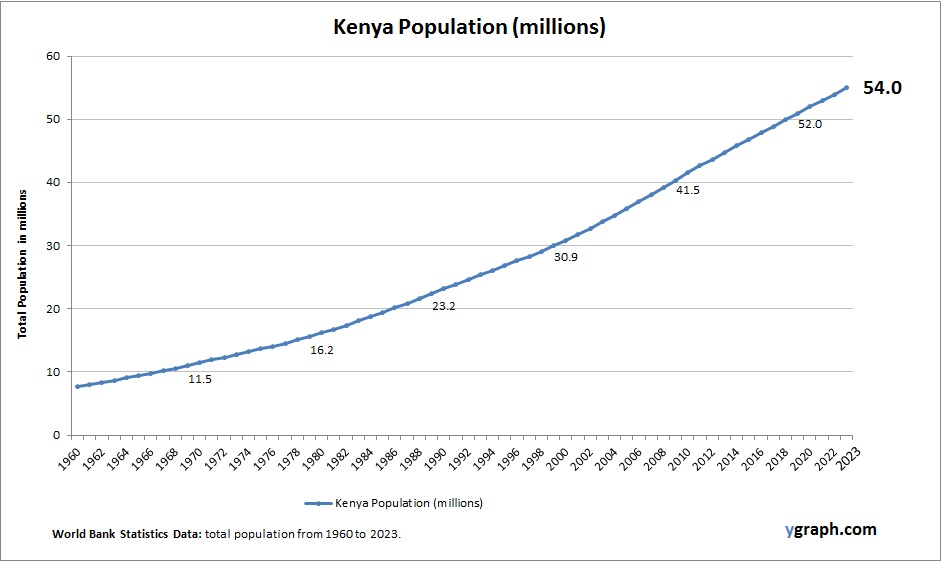
Gibraltar Population

The above graph shows Gibraltar Population. This is according to World Bank total population stats. Latest population information for Gibraltar.

Gibraltar has a small but stable population, largely influenced by its strategic location and economic ties to the UK. Fertility rates are modest, and migration, both short- and long-term, plays a significant role in shaping population dynamics.

Gibraltar Population

Guinea Bissau Population

The above graph shows Guinea Bissau Population. World Bank is the source of this population data. Based on the latest demographics info provided for Guinea Bissau.

Guinea Bissau has a small but growing population with high fertility rates contributing to rapid demographic expansion. Limited healthcare infrastructure and economic challenges shape population dynamics, while migration and urbanization are gradually influencing settlement patterns.

Guinea Bissau Population

East Asia & Pacific Births per woman

The above graph shows East Asia & Pacific Births per woman. The fertility rate statistics are compiled by World Bank. Based on the latest available information for East Asia & Pacific.

Across the East Asia and Pacific region, fertility rates have dropped significantly, in some countries falling well below replacement levels. Nations such as Japan, South Korea, and China are dealing with aging populations, while others like Vietnam and Indonesia maintain slightly higher fertility rates. Economic development, urbanization, and gender equality initiatives have all contributed to these demographic changes.

East Asia & Pacific Births per woman

France Births per woman

This diagram presents France Births per woman. World Bank is the source of this birth data. Latest births per woman information for France.

France has relatively high fertility rates compared to other European countries, supported by generous family policies, childcare, and parental leave. While birth rates remain below replacement in some areas, social support systems help maintain population stability and moderate growth.

France Births per woman

St. Lucia Births per woman

The above graph shows St. Lucia Births per woman. World Bank is the source of this birth data. Based on the latest available information for St. Lucia.

St. Lucia’s fertility rate is moderate but has been declining as urbanization and education increase. Economic reliance on tourism and migration patterns influence family size decisions. Social services and healthcare improvements contribute to demographic changes, with challenges in sustaining population growth and supporting an aging population.

St. Lucia Births per woman

Brunei Darussalam Births per woman

Chart above demonstrates Brunei Darussalam Births per woman. The fertility rate statistics are compiled by World Bank. Latest births per woman information for Brunei Darussalam.

Brunei Darussalam has a moderate fertility rate, slightly above replacement level but trending downward over recent years. The country has a relatively high standard of living, and increased urbanization and access to education have led to smaller family sizes. Government policies support maternal health, but lifestyle and economic factors continue to influence reproductive behavior.

Brunei Darussalam Births per woman

Europe & Central Asia (excluding high income) Population

Chart above demonstrates Europe & Central Asia (excluding high income) Population. The country statistics are compiled by World Bank. Based on the latest demographics info provided for Europe & Central Asia (excluding high income).

This region faces mixed population trends—some countries are aging and shrinking, while others still experience moderate growth. Urbanization, migration, and fertility declines define regional demographic shifts, prompting policy adjustments for sustainable development.

Europe & Central Asia (excluding high income) Population

Middle East & North Africa (IDA & IBRD countries) Population

This diagram presents Middle East & North Africa (IDA & IBRD countries) Population. The country statistics are compiled by World Bank. Based on the latest demographics info provided for Middle East & North Africa (IDA & IBRD countries).

The population of Middle East and North Africa countries classified as IDA and IBRD reflects a young demographic with high fertility rates relative to global averages. Rapid urbanization, economic diversification, and improvements in healthcare are shaping demographic transitions, but population growth continues to challenge resource allocation and development efforts.

Middle East & North Africa (IDA & IBRD countries) Population

Sweden Population

Chart above demonstrates Sweden Population. This is according to World Bank total population stats. Based on the latest demographics info provided for Sweden.

Sweden has a stable population with fertility rates close to replacement level, supported by comprehensive social policies such as generous parental leave and childcare support. Immigration contributes significantly to population growth, and urban areas continue to expand. The country’s demographic trends reflect a balance between aging and renewal.

Sweden Population

Guatemala Births per woman

The above graph shows Guatemala Births per woman. World Bank is the source of this birth data. Based on the latest demographics info provided for Guatemala.

Guatemala maintains relatively high fertility rates driven by cultural norms and limited access to family planning in rural areas. Urbanization and education are gradually contributing to fertility declines. Population growth remains strong, with a youthful demographic shaping social and economic needs.

Guatemala Births per woman