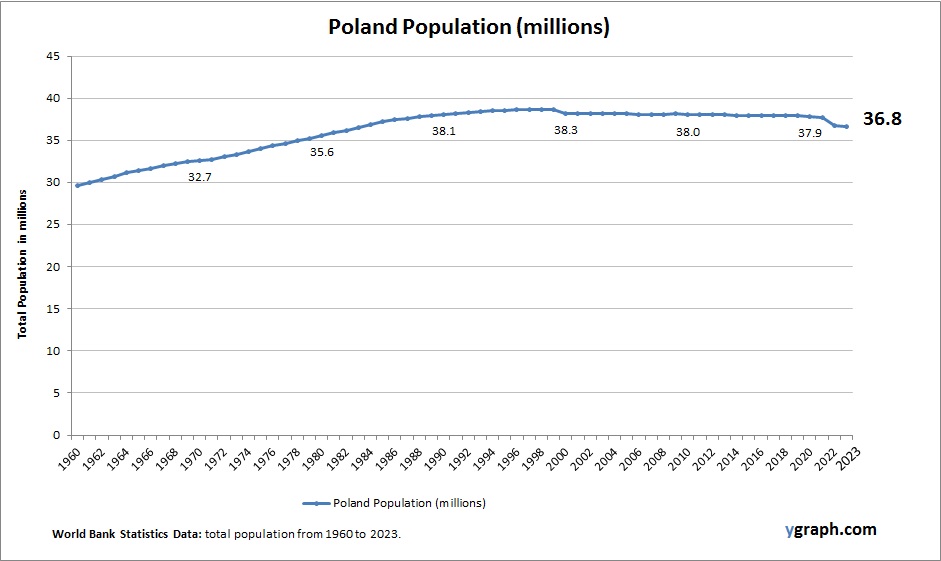
Poland Population

Poland’s population is slowly declining due to low fertility rates and net emigration. The country faces demographic challenges associated with an aging population and shrinking workforce. Urban centers maintain stable populations, while rural areas experience decline. Efforts to encourage higher birth rates and attract immigration are ongoing to mitigate demographic pressures.

Poland Population

Population Graphs

Population graphs are visual tools that display demographic data such as age distribution, fertility rates, and growth trends. Common types include population pyramids, line graphs showing population changes over time, and bar charts comparing regional demographics, all of which help analyze and interpret population dynamics effectively.

Population Graphs

Population Pyramid Chart

A population pyramid chart visually represents the age and sex distribution of a population, showing the proportion of individuals in different age groups. This tool helps identify demographic trends such as youth bulges, aging populations, or imbalances caused by migration or other factors, and is widely used in demographic and social planning.

Population Pyramid Chart In Excel

World Population Projections & Age Profile

Global population projections indicate slowing growth with increasing aging, especially in developed regions. Youthful populations will persist in parts of Africa and Asia, creating diverse age profiles that demand tailored policy responses worldwide.

World Population Projections & Age Profile

United States population projection

The U.S. population is projected to continue growing slowly, driven largely by immigration, as birth rates remain below replacement level. Aging is a key trend, with a rising share of the population over 65, influencing healthcare, social services, and labor market needs.

United States population projection

World population pyramid

The world population pyramid shows a broad base in many developing regions, indicating a large number of young people and high fertility rates. In contrast, developed regions display narrower bases and more rectangular shapes, reflecting aging populations and lower fertility. This demographic divide shapes global economic and social trends.

World population pyramid

China future population

China’s future population is expected to decline significantly in the coming decades due to sustained low fertility rates and the legacy of the one-child policy. An aging population and a shrinking labor force pose major economic and social challenges. The government has relaxed family planning rules, but reversing the trend has proven difficult.

China future population

USA population pyramid

The USA population pyramid reflects a relatively balanced age distribution with a slight aging trend due to declining fertility and increasing life expectancy. Immigration bolsters younger age groups, and urban areas experience significant growth. The demographic profile supports a large workforce but raises concerns about healthcare and social security sustainability for an aging population.

USA population pyramid

India future population

India is projected to surpass China as the world’s most populous country soon, with population growth slowing but still positive due to declining fertility rates. A youthful demographic offers economic potential, but challenges remain in providing adequate healthcare, education, and employment for its vast population.

India future population