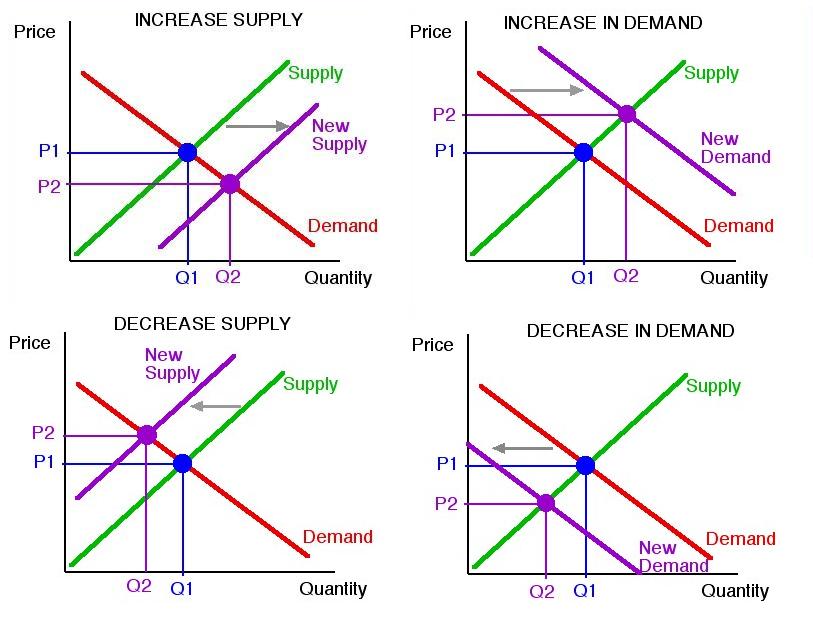
Supply and Demand – Supply Demand Chart

Supply and Demand – Supply Demand Chart – Economic Chart – Demand and Supply Diagram. Price Quantity Diagram. Economic equilibrium chart. PQ diagram. Demand Shift and supply shift due to changes . Source: Economic Perspectives https://ygraph.com/chart/2224

Supply and Demand – Supply Demand Chart

Supply Graph. Demand Graph. Supply vs Demand Graph

Supply Graph. Demand Graph. Increase Demand, Increase Supply, Decrease in Demand, Decrease in Supply. The main demand and supply shifts from market equilibrium. Demand shift, supply shift. Market equilibrium shifts. Price and Quantity Graphs. Source: Ray Bromley https://ygraph.com/chart/2225

Supply Graph. Demand Graph. Increase De