Skip to content
cropped logo

Ygraph

Charts, Graphs and Diagrams

Menu

Primary menu

  • Submit Diagram
  • Science
  • Business
  • Economy
    • GDP
  • Demographics
  • Explained
    • Signs
    • Maps
  • Health
  • Anatomy
  • Sizes

Tag Archives: media source analysis chart

Media Bias Chart (2018)

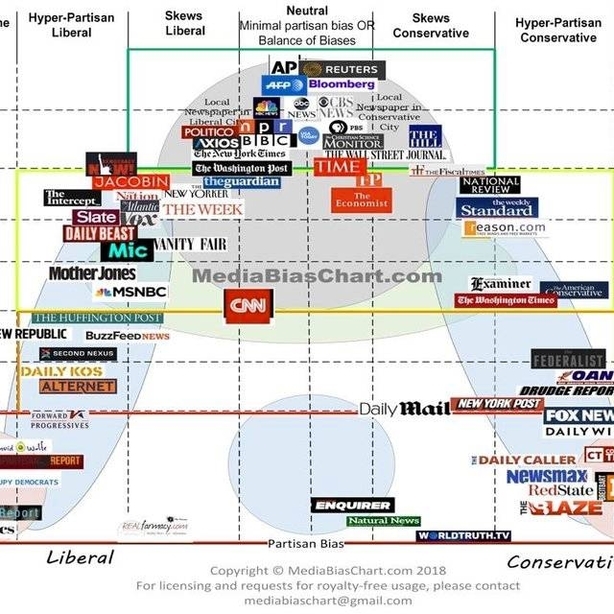
Media Bias (2018): Media bias in 2018 refers to the perceived or actual partiality in news reporting and media coverage. It involves the tendency of media outlets to favor certain viewpoints, political ideologies, or interests, influencing public perception and opinion.

Media Bias Chart (2018)
Posted in chart | Tagged 2018 media bias explained, media bias diagram, media source analysis chart, news bias visual, political bias in media

Primary Sidebar Widget Area

Top Diagrams

Latest Posts

  • How to Stop Time from Flying
  • Scientific Diagram
  • History Diagram
  • Smale horseshoe tranformation
  • Strange Science Diagrams
  • Parenting Differences Between Liberals And Conservatives
  • Cancer Survivors In The Us By Age
  • World Population Projections
  • China Births per woman
  • Parts Of A Lion
  • Dominica Births per woman
  • Cognitive Examined
  • South Korea Births per woman
  • Georgia Population
  • Demographic Diagram 1
  • Economics Diagrameconomic Flow Diagram 3

Top Tags

  • sizes (35)
  • size chart (35)
  • size conversion (35)
  • economy chart (33)
  • economy graph (33)
  • economy diagram (33)
  • cell (29)
  • cell diagram (29)
  • cell illustration (29)
  • window (24)
  • window diagram (24)
  • types of windows (24)
  • origami (16)
  • origami steps (16)
  • how to make origami (16)
  • biology (16)
  • biology diagram (16)
  • yoga (8)
  • yoga routine (8)
  • yoga poses (8)

Categories

  • anatomy
  • Business
  • chart
  • Demographics
  • Eco
  • Ecom
  • Economy
  • Explained
  • GDP
  • Health
  • Maps
  • notice
  • science
  • Signs
  • Sizes
  • Uncategorized

Useful Resources

  • Chart Diagram
  • Meme Gif
  • Logo Sign
  • Human Anatomy
  • Graph Diagram
  • Economy GDP
  • Twitter
Copyright © 2025 Ygraph. All Rights Reserved.
Theme: Catch Box by Catch Themes
Scroll Up
WP Twitter Auto Publish Powered By : XYZScripts.com