Skip to content
cropped logo

Ygraph

Charts, Graphs and Diagrams

Menu

Primary menu

  • Submit Diagram
  • Science
  • Business
  • Economy
    • GDP
  • Demographics
  • Explained
    • Signs
    • Maps
  • Health
  • Anatomy
  • Sizes

Filter funnel diagram

Filter funnel diagram

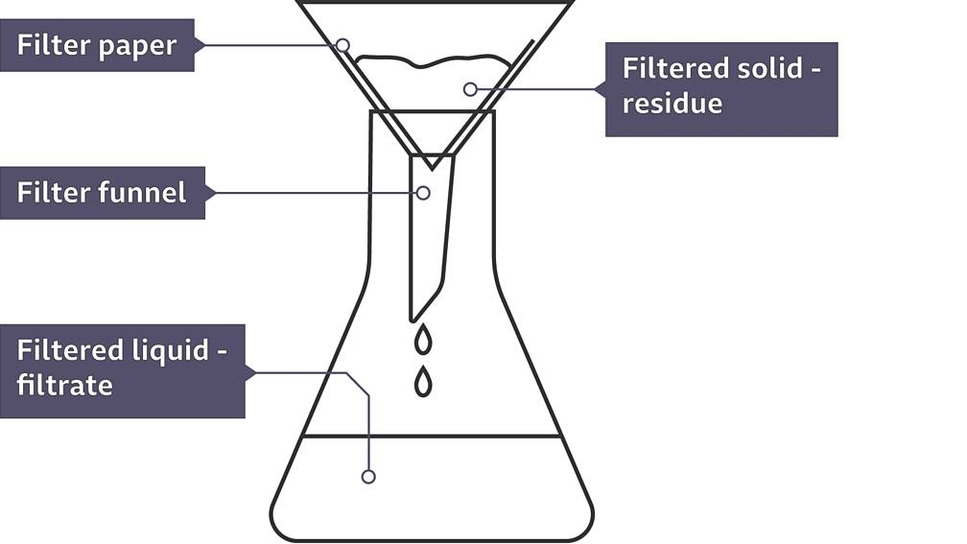
Filter Funnel Diagram: A filter funnel diagram illustrates the process of filtration, showing how a mixture is poured through a funnel containing filter paper. The solid particles are trapped by the filter paper, while the liquid passes through, demonstrating the separation of components.

chemistry apparatus chart, filter funnel diagram, filtration process, lab equipment labeled, science experiment tools

Post navigation

← Previous Previous post: Papua New Guinea Population
Next → Next post: Malaysia Births per woman

Primary Sidebar Widget Area

Top Diagrams

Latest Posts

  • Indonesia Births per woman
  • Venezuela Births per woman
  • United States Population
  • Physics Of Magnetic Fields
  • Health Venn Diagram Framework
  • Translation And Transcription In Biology
  • Qatar Births per woman
  • Eswatini Births per woman
  • Curacao Births per woman
  • Genetic Engineering Of Bacteria For Insulin Production
  • St. Lucia Population
  • Algeria Population
  • Scientific Diagram Drawing
  • Russia Births per woman
  • Types Of Diagrams For Kids

Top Tags

  • sizes (35)
  • size chart (35)
  • size conversion (35)
  • economy chart (33)
  • economy graph (33)
  • economy diagram (33)
  • cell (29)
  • cell diagram (29)
  • cell illustration (29)
  • window (24)
  • window diagram (24)
  • types of windows (24)
  • origami (16)
  • origami steps (16)
  • how to make origami (16)
  • biology (16)
  • biology diagram (16)
  • yoga (8)
  • yoga routine (8)
  • yoga poses (8)

Categories

  • anatomy
  • Business
  • chart
  • Demographics
  • Eco
  • Ecom
  • Economy
  • Explained
  • GDP
  • Health
  • Maps
  • notice
  • science
  • Signs
  • Sizes
  • Uncategorized

Useful Resources

  • Chart Diagram
  • Meme Gif
  • Logo Sign
  • Human Anatomy
  • Graph Diagram
  • Economy GDP
  • Twitter
Copyright © 2026 Ygraph. All Rights Reserved.
Theme: Catch Box by Catch Themes
Scroll Up
WP Twitter Auto Publish Powered By : XYZScripts.com