Vector Addition Diagram

Vector addition is a fundamental operation in linear algebra that involves adding two or more vectors together to obtain a resultant vector. It is used to describe the motion of objects in space, forces acting on objects, and many other physical phenomena.

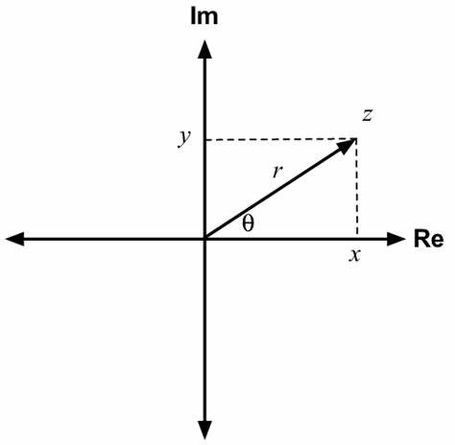
Vectors are mathematical objects that have both magnitude and direction. They can be represented graphically as arrows, where the length of the arrow represents the magnitude of the vector and the direction of the arrow represents the direction of the vector. Vector addition is the process of adding two or more vectors together to obtain a new vector that represents the sum of the original vectors.

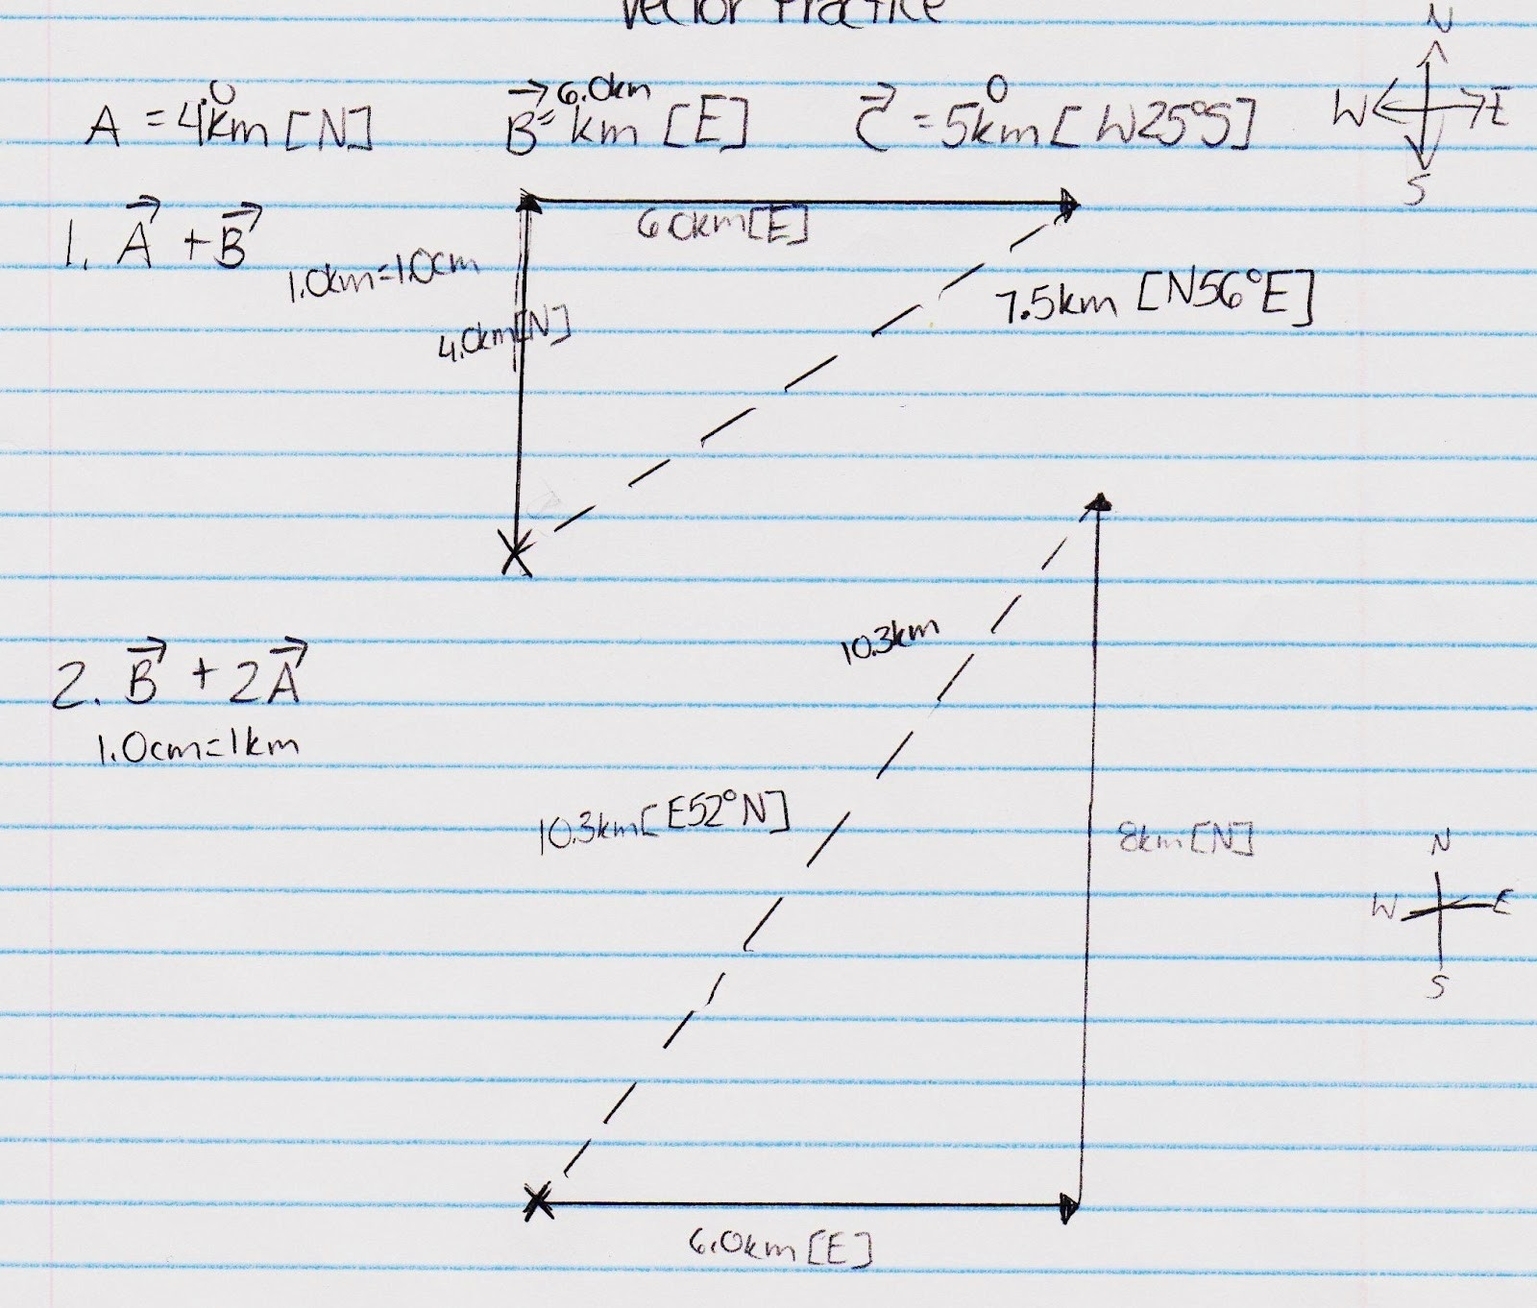
There are two methods for adding vectors: algebraically and graphically. Algebraic addition involves adding the corresponding components of the vectors together. For example, if we have two vectors A and B, with components (a1, a2, a3) and (b1, b2, b3), respectively, then the sum of the two vectors is (a1+b1, a2+b2, a3+b3). Graphical addition involves placing the tail of one vector at the head of the other vector and drawing the resultant vector from the tail of the first vector to the head of the second vector. The resultant vector is the vector that connects the tail of the first vector to the head of the second vector.

Vector addition has several important properties. First, it is commutative, which means that the order in which the vectors are added does not matter. That is, A + B = B + A. Second, it is associative, which means that the way in which the vectors are grouped does not matter. That is, (A + B) + C = A + (B + C). Finally, it is distributive, which means that scalar multiplication can be distributed over vector addition. That is, a(A + B) = aA + aB, where a is a scalar.

Vector addition is used in many areas of science and engineering. For example, it is used to describe the motion of objects in space, such as the motion of planets around the sun. It is also used to describe the forces acting on objects, such as the forces acting on a bridge or a building.

Vector Addition Diagram

Introduction To Sets & Venn Diagrams

A set is a collection of distinct objects, which can be anything from numbers to colors to people. Sets are usually denoted by capital letters, and their elements are enclosed in curly braces. For example, the set of all even numbers can be written as {2, 4, 6, 8, …}, while the set of primary colors can be written as {red, blue, yellow}.
ets can be combined using various operations, such as union, intersection, and complement. The union of two sets A and B is the set of all elements that belong to either A or B (or both), and is denoted by A ? B. The intersection of two sets A and B is the set of all elements that belong to both A and B, and is denoted by A ? B. The complement of a set A is the set of all elements that do not belong to A, and is denoted by A’.

Venn diagrams are a useful tool for visualizing sets and their relationships. A Venn diagram consists of one or more circles, each representing a set, and the area inside the circle represents the elements of the set. The circles can overlap, and the overlapping region represents the elements that belong to both sets. For example, if we have two sets A and B, we can draw a Venn diagram with two circles, one for A and one for B, and the overlapping region represents the elements that belong to both A and B.

Venn diagrams can be used to illustrate various set operations. For example, the union of two sets A and B can be represented by the entire area inside both circles, while the intersection of A and B can be represented by the overlapping region. The complement of a set A can be represented by the area outside the circle representing A.

Introduction To Sets & Venn Diagrams

Architecture Timeline

Architecture is the art and science of designing and constructing buildings and other structures. Architecture has a long and diverse history, reflecting the culture, technology, and aspirations of different societies and periods. Here is a brief overview of some of the major architectural styles and movements in history, from prehistoric times to the present day.

– Prehistoric architecture (11,600 BCE – 3,500 BCE): The earliest human-made structures, such as earthen mounds, stone circles, megaliths, and cliff dwellings. Examples include Stonehenge in England, Göbekli Tepe in Turkey, and the pyramids of Egypt.
– Ancient architecture (3,500 BCE – 476 CE): The architecture of ancient civilizations, such as Mesopotamia, Egypt, Greece, Rome, India, China, and the Americas. Characterized by monumental temples, palaces, tombs, and civic buildings, often decorated with sculptures, paintings, and reliefs. Examples include the Parthenon in Greece, the Colosseum in Rome, the Great Wall of China, and the Maya city of Tikal.
– Medieval architecture (476 CE – 1400 CE): The architecture of the Middle Ages, influenced by the Roman, Byzantine, Islamic, and Gothic styles. Characterized by the use of arches, vaults, domes, towers, and stained glass windows, often in religious buildings such as churches, cathedrals, and monasteries. Examples include Hagia Sophia in Turkey, Notre Dame in France, the Alhambra in Spain, and Angkor

Architecture Timeline

Chemistry Lab Equipment

Chemistry lab equipment is a collection of tools and instruments used in chemistry experiments and research. These tools are designed to help chemists perform experiments safely and accurately. Here are some of the most common pieces of equipment used in chemistry labs:

1. Beakers: These are cylindrical containers with flat bottoms and a lip for pouring. They are used for mixing, heating, and storing liquids.

2. Erlenmeyer flasks: These are conical-shaped containers with a flat bottom and a narrow neck. They are used for mixing, heating, and storing liquids.

3. Test tubes: These are small cylindrical containers with a rounded bottom and an open top. They are used for holding, mixing, and heating small amounts of liquids.

4. Pipettes: These are small glass or plastic tubes used to transfer small amounts of liquid from one container to another.

5. Burettes: These are long, thin glass tubes with a stopcock at the bottom. They are used to measure and dispense precise amounts of liquid.

6. Graduated cylinders: These are tall, narrow containers with a flat base and a spout for pouring. They are used to measure the volume of liquids.

7. Thermometers: These are instruments used to measure temperature. They are commonly used in chemistry labs to monitor the temperature of liquids during experiments.

8. Hot plates: These are electrically heated plates used to heat substances in the lab. They are commonly used in chemistry labs to heat liquids and solids.

9. Bunsen burners: These are gas burners used to heat substances in the lab. They are commonly used in chemistry labs to heat liquids and solids.

10. Safety goggles: These are protective eyewear worn by chemists to protect their eyes from chemical splashes and other hazards.

These are just a few examples of the many types of equipment used in chemistry labs. Other common pieces of equipment include balances, centrifuges, microscopes, and spectrophotometers.

Chemistry Lab Equipment

Sicentific Revolution

The Scientific Revolution was a period of profound changes in scientific thought and practice that occurred in Europe from the 16th to the 17th centuries. It challenged the traditional views of nature that had been inherited from ancient Greek and Roman authorities, and introduced new methods of observation, experimentation, and reasoning that laid the foundations of modern science. Here is a brief summary of the main features and achievements of the Scientific Revolution in about 1000 words:

The Scientific Revolution began with the publication of Nicolaus Copernicus’s book On the Revolutions of the Heavenly Spheres in 1543, which proposed a heliocentric model of the universe, in contrast to the geocentric model that had been accepted for centuries. Copernicus’s work inspired other astronomers, such as Tycho Brahe, Johannes Kepler, and Galileo Galilei, to observe the heavens with new instruments and techniques, and to discover new phenomena, such as the phases of Venus, the moons of Jupiter, and the elliptical orbits of the planets. These discoveries challenged the prevailing Aristotelian-Ptolemaic system, which assumed that the Earth was at the center of a series of concentric spheres that carried the planets and stars in perfect circles. The Copernican system also had theological implications, as it implied that the Earth was not a special place in God’s creation, but one among many other worlds.

The Scientific Revolution also involved a transformation of the study of nature on Earth, especially in the fields of physics, chemistry, and biology. One of the key figures in this transformation was Isaac Newton, who synthesized the laws of motion and universal gravitation in his monumental work Principia Mathematica, published in 1687. Newton’s physics provided a mathematical framework that could explain the motions of both terrestrial and celestial bodies, and that could be tested by experiments and observations. Newton also contributed to the

Sicentific Revolution

Maths Sets Venn Diagrams

ets are a fundamental concept in mathematics. A set is a collection of distinct objects, called elements. For example, the set of all even numbers is a set that contains the elements 2, 4, 6, 8, and so on. Sets can be defined by listing their elements, or by specifying a rule that determines which elements belong to the set.

Venn diagrams are a tool used to visualize sets and their relationships. They are named after John Venn, a British logician and philosopher who introduced them in the late 19th century. Venn diagrams consist of one or more circles that represent sets. The circles are drawn inside a rectangle that represents the universal set, which is the set of all possible elements.

The elements of a set are represented by points inside the circle that corresponds to the set. For example, if we have two sets A and B, we can represent them using two circles that overlap. The elements that belong to both sets are represented by points inside the overlapping region. The elements that belong to only one of the sets are represented by points inside the non-overlapping regions.

The intersection of two sets A and B is the set of elements that belong to both A and B. It is denoted by A ? B. The union of two sets A and B is the set of elements that belong to either A or B, or both. It is denoted by A ? B. The complement of a set A is the set of elements that do not belong to A. It is denoted by A’.

Venn diagrams can be used to illustrate these concepts. For example, we can draw two circles that overlap to represent two sets A and B. The overlapping region represents the intersection A ? B. The non-overlapping regions represent the sets A’ and B’, respectively. The entire rectangle represents the universal set.

Venn diagrams can also be used to illustrate more complex relationships between sets. For example, we can draw three circles that overlap to represent three sets A, B, and C. The overlapping regions represent the intersections A ? B, A ? C, and B ? C, respectively. The region where all three circles overlap represents the intersection A ? B ?

Maths Sets Venn Diagrams

Free Body Force Physics

Free body force physics is a branch of physics that deals with the analysis of forces and moments acting on a body in a given situation. A free body diagram (FBD) is a graphical tool that helps to visualize and simplify the problem by showing only the relevant forces and their directions. Here is an example of a free body diagram for a block resting on a ramp:

“`latex
begin{tikzpicture}
% Draw the ramp
draw[thick] (0,0) — (4,2);
draw[dashed] (0,0) — (4,0);
draw[<->] (2,0) arc (0:26.6:2) node[midway,right] {$theta$};
% Draw the block
draw[fill=gray] (2.5,1.25) rectangle (3.5,2.25) node[midway] {$m$};
% Draw the forces
draw[->,red,thick] (3,2.25) — (3,3.25) node[above] {$F_N$};
draw[->,red,thick] (3,1.25) — (3,0.25) node[below] {$mg$};
draw[->,red,thick] (2.5,1.75) — (1.5,1.75) node[left] {$F_f$};
end{tikzpicture}
“`

In this diagram, the block has a mass $m$ and is subject to three forces: the normal force $F_N$, the weight $mg$, and the friction force $F_f$. The angle of the ramp is $theta$. The goal of free body force physics is to find the magnitude and direction of these forces, as well as the acceleration and motion of the block, using Newton’s laws of motion and some basic trigonometry.

One of the main principles of free body force physics is that the net force on a body is equal to its mass times its acceleration, or $sum F = ma$. This means that we can write equations for the horizontal and vertical components of the net

Free Body Force Physics

Moore’s Law

Moore’s Law is an empirical observation that the number of transistors in an integrated circuit (IC) doubles approximately every two years. It is named after Gordon Moore, the co-founder of Fairchild Semiconductor and Intel. Moore’s Law is not a law of physics, but rather an observation and projection of a historical trend. The observation was first made in 1965, when Moore posited a doubling every year in the number of components per integrated circuit, and projected this rate of growth would continue for at least another decade. In 1975, looking forward to the next decade, he revised the forecast to doubling every two years, a compound annual growth rate (CAGR) of 41%. While Moore did not use empirical evidence in forecasting that the historical trend would continue, his prediction has held since 1975 and has since become known as a “law” .

Moore’s Law has been used in the semiconductor industry to guide long-term planning and to set targets for research and development, thus functioning to some extent as a self-fulfilling prophecy. Advancements in digital electronics, such as the reduction in quality-adjusted microprocessor prices, the increase in memory capacity (RAM and flash), the improvement of sensors, and even the number and size of pixels in digital cameras, are strongly linked to Moore’s Law . These ongoing changes in digital electronics have been a driving force of technological and social change, productivity, and economic growth.

However, industry experts have not reached a consensus on exactly when Moore’s Law will cease to apply. Microprocessor architects report that semiconductor advancement has slowed industry-wide since around 2010, slightly below the pace predicted by Moore’s law . The slowing of Moore’s Law has been attributed to several factors, including the increasing difficulty of manufacturing at smaller scales, the increasing cost of research and development, and the physical limitations of the materials used in semiconductor manufacturing .

In conclusion, Moore’s Law has been a driving force behind the rapid advancement of digital electronics and has played a significant role in shaping the modern world. While the pace of advancement may slow in the future, the impact of Moore’s Law on technology and society will continue to be felt for years to come..

Moore's Law

Argand Diagram

Argand was a Swiss amateur mathematician who lived in the late 18th and early 19th centuries. He is best known for his contributions to the field of complex analysis, especially the geometric representation of complex numbers and the proof of the fundamental theorem of algebra.

Complex numbers are numbers of the form x + iy, where x and y are real numbers and i is the imaginary unit, defined by i^2 = -1. Argand realized that complex numbers can be visualized as points on a plane, where the horizontal axis is the real part and the vertical axis is the imaginary part. This plane is now called the Argand plane or the complex plane. On this plane, complex numbers can be expressed in polar coordinates as well, using the modulus (or absolute value) and the argument (or angle) of the complex number. Argand also introduced the notation for the modulus of a complex number, denoted by |z|, and the concept of vectors, which are directed line segments that represent complex numbers.

Argand also provided the first rigorous proof of the fundamental theorem of algebra, which states that every polynomial equation with complex coefficients has at least one complex root. His proof was based on the idea of winding numbers, which count how many times a curve winds around a point. He showed that if a polynomial has no roots, then its winding number around any point is zero, which leads to a contradiction. His proof was published in 1814, but it was not widely recognized until later, when it was reproduced by Cauchy and Chrystal in their textbooks.

Argand was not a professional mathematician, but rather a self-taught enthusiast who pursued mathematics as a hobby. He worked as a bookshop manager in Paris, where he published his works privately or in journals. He died in

Argand Diagram