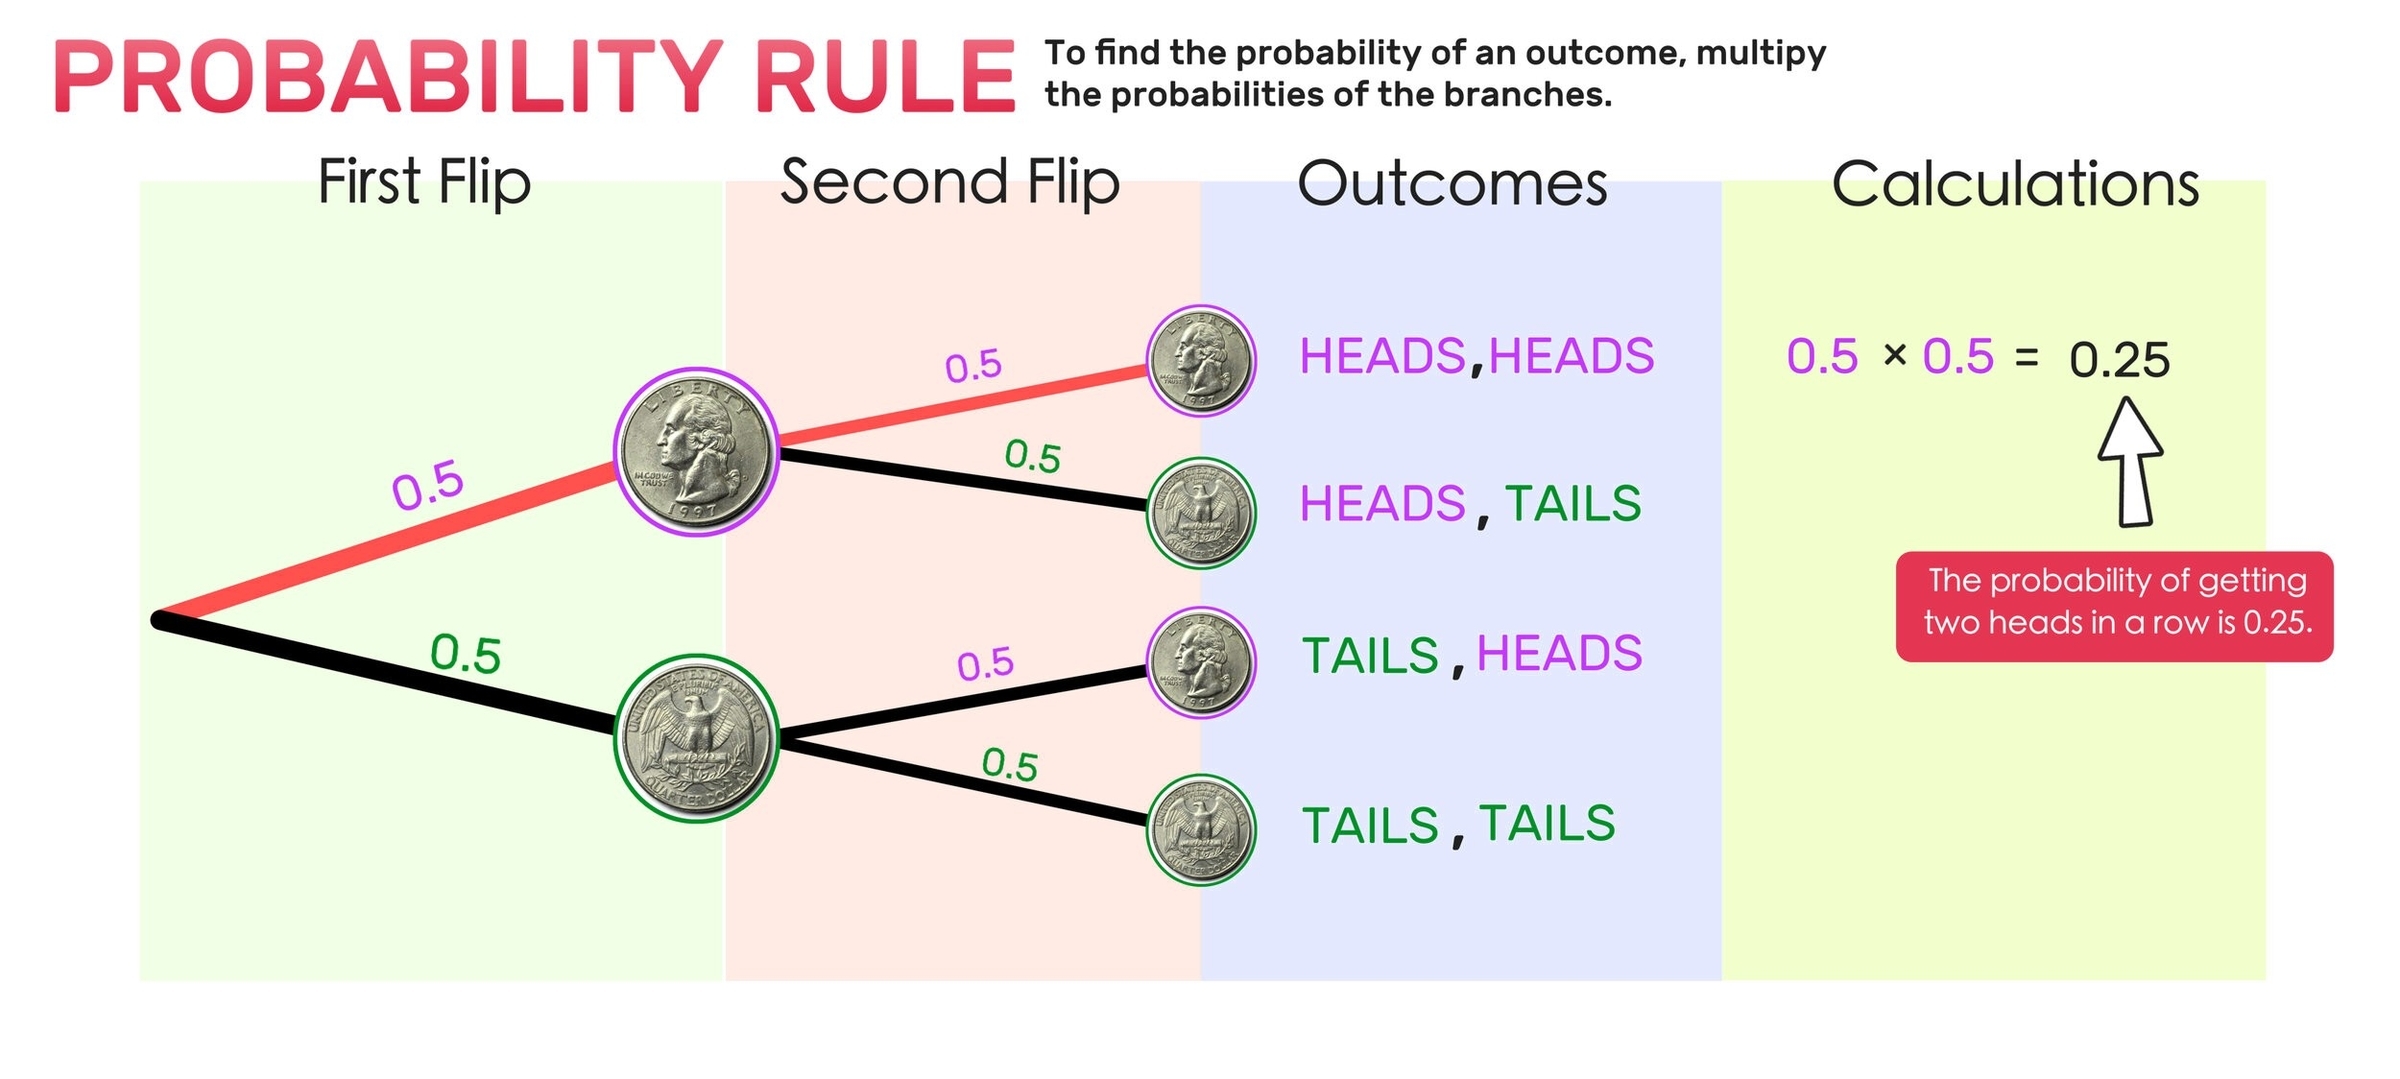
Processes Of A Farming System

A farming system is a complex network of interdependent components that work together to produce crops and livestock. These components include the physical resources such as land, water, and machinery, as well as the human resources such as labor and management. The processes of a farming system refer to the activities that take place on a farm, such as planting, harvesting, and milking .

Agricultural systems can be described in many ways, and researchers and farmers alike have used a variety of terms, such as farming system, cropping system, organic, ecological, to identify agricultural systems based on particular characteristics or definitions . For the purposes of this response, we will use the term agricultural system to refer broadly to any system that produces livestock and crops (food, feed, fiber and/or energy), including the social, political and economic components of that system .

The processes of a farming system can be divided into two categories: primary and secondary activities. Primary activities are those that are directly involved in the production of crops and livestock, such as planting, harvesting, and milking. Secondary activities are those that support the primary activities, such as marketing, processing, and distribution .

The primary activities of a farming system can be further divided into four stages: land preparation, crop production, livestock production, and harvesting. Land preparation involves clearing the land, plowing, and fertilizing the soil. Crop production involves planting, irrigating, and protecting the crops from pests and diseases. Livestock production involves breeding, feeding, and caring for the animals. Harvesting involves collecting the crops and preparing them for sale or storage .

The secondary activities of a farming system are just as important as the primary activities. Marketing involves identifying potential buyers and selling the crops and livestock. Processing involves converting the raw materials into finished products, such as flour, cheese, or leather. Distribution involves transporting the products to the buyers .

In addition to these primary and secondary activities, there are several other processes that are important to the functioning of a farming system. These include soil conservation, water management, and pest management. Soil conservation involves practices that help to maintain the health of the soil, such as crop rotation, cover cropping, and reduced tillage. Water management involves practices that help to conserve water, such as drip irrigation and rainwater harvesting. Pest management involves practices that help to control pests and diseases, such as biological control and integrated pest management .

In conclusion, a farming system is a complex network of interdependent components that work together to produce crops and livestock. The processes of a farming system can be divided into primary and secondary activities, which involve land preparation, crop production, livestock production, harvesting, marketing, processing, and distribution. In addition to these activities, soil conservation, water management, and pest management are also important processes in a farming system .

Processes Of A Farming System

Demographic Transition Model

The Demographic Transition Model (DTM) is a way to understand how populations change over time. It shows how societies go from having high birth and death rates to having low birth and death rates as they develop and become more industrialized.

The DTM has five stages, each with a different relationship between birth and death rates:

– Stage 1: High birth and death rates. Population size is stable but can fluctuate due to wars, famines, or epidemics. This stage applies to most of the world before the Industrial Revolution.
– Stage 2: High birth rate and declining death rate. Population growth is rapid due to improvements in health, sanitation, and food production. This stage applies to many developing countries today, such as India and Nigeria.
– Stage 3: Declining birth rate and low death rate. Population growth slows down as people have fewer children due to urbanization, education, and family planning. This stage applies to many developed countries today, such as the United States and Canada.
– Stage 4: Low birth and death rates. Population size is stable or slightly declining due to low fertility and mortality. This stage applies to some developed countries today, such as Japan and Germany.
– Stage 5: Very low birth rate and increasing death rate. Population size is declining due to aging, low fertility, and high mortality. This stage is hypothetical and has not been observed in any country yet.

The DTM is based on historical data and patterns, but it is not a fixed or deterministic model. Different countries may experience different transitions depending on their social, economic, and cultural factors. The DTM also does not account for other factors that may affect population dynamics, such as migration, environmental issues, or political conflicts.

The DTM is useful for understanding how population growth and development are related, and how they may affect the environment and the economy. The DTM can also help policymakers and planners to address the challenges and opportunities of different stages of demographic transition.

Here is a summary of the DTM in a table format:

| Stage | Birth Rate | Death Rate | Population Growth | Example |
| — | — | — | — | — |
| 1 | High | High | Stable or fluctuating | Pre-industrial societies |
| 2 | High | Declining |

Demographic Transition Model

Geologic Story Of Yosemite National Park

The geologic story of Yosemite National Park is a fascinating tale of how the forces of nature shaped the landscape over hundreds of millions of years. Here is a brief summary of the main events and processes that created the park’s iconic features.

The first part of the story involves the formation of the granitic rocks that make up most of the park’s bedrock. These rocks originated from molten magma that rose from the Earth’s mantle and intruded into older sedimentary and volcanic rocks that were deposited in a shallow sea. The magma cooled and solidified underground, forming large bodies of igneous rock called plutons. The older rocks were metamorphosed by the heat and pressure of the magma, creating schist, marble, and quartzite. This process occurred from about 210 to 80 million years ago, during the Paleozoic and Mesozoic eras, when the western edge of North America was a subduction zone, where an oceanic plate was diving under the continental plate.

The second part of the story involves the uplift, erosion, and glaciation of the granitic rocks to create the present-day landscape. The uplift began about 25 million years ago, during the Cenozoic era, when the subduction zone ceased and the Sierra Nevada block started to rise and tilt westward along a fault system. The uplift exposed the granitic rocks to the surface, where they were eroded by water, wind, and ice. The erosion carved out valleys, canyons, and domes, and also transported sediments to the lower elevations. The glaciation occurred during the Pleistocene epoch, from about 2.6 million to 10,000 years ago, when the climate was colder and ice sheets covered much of the northern hemisphere. Glaciers formed in the high mountains and flowed down the valleys, scouring and polishing the rocks, and depositing moraines and outwash. The glaciers also widened, deepened, and straightened the valleys, creating the characteristic U-shaped cross-section

Geologic Story Of Yosemite National Park

Population Pyramid Of The U.s. In 2015

A population pyramid is a graphical representation of the age and sex distribution of a population. It shows how many people of each gender and age group are living in a country or region at a given time.

The population pyramid of the U.S. in 2015 was shaped like a column, with a wide base and a narrow top. This indicates that the U.S. had a relatively balanced population structure, with a large number of people in the working-age groups (15-64 years) and a smaller number of people in the dependent groups (under 15 and over 65 years).

The U.S. population pyramid in 2015 also showed some distinctive features, such as:

– The baby boomers, a large cohort of people born between 1946 and 1964, were in the 51-69 age range. They accounted for about 23% of the total population and had a significant impact on the social and economic trends of the country.
– The millennials, a generation of people born between 1981 and 1996, were in the 19-34 age range. They were the largest living generation in the U.S., surpassing the baby boomers in 2015. They represented about 27% of the total population and had diverse characteristics and preferences.
– The immigration effect, which refers to the influence of foreign-born people on the population structure. The U.S. had a high rate of immigration, especially from Latin America and Asia, which contributed to the growth and diversity of the population. The foreign-born population was about 14% of the total population in 2015, and most of them were in the 25-54 age range.
– The gender gap, which means the difference between the number of males and females in a population. The U.S. had a slightly higher number of females than males in 2015, with a sex ratio of 97.1 males per

Population Pyramid Of The U.s. In 2015

Organic Chemistry Reactions 20

Organic Chemistry Reactions 20 is a topic that covers a wide range of chemical reactions that involve organic compounds. Organic chemistry is the study of carbon-based compounds, which are found in living organisms and are essential to life. Organic chemistry reactions are the chemical transformations that occur when organic compounds interact with each other or with other substances.

There are many different types of organic chemistry reactions, but some of the most common ones include substitution reactions, elimination reactions, addition reactions, radical reactions, and oxidation-reduction reactions . These reactions can be further classified into different categories based on the type of reaction mechanism involved, such as electrophilic addition, nucleophilic substitution, and free radical reactions .

One of the most important aspects of organic chemistry reactions is understanding the mechanisms behind them. Reaction mechanisms describe the step-by-step process by which a chemical reaction occurs, including the formation and breaking of chemical bonds. Understanding these mechanisms is essential for predicting the outcome of a reaction and for designing new reactions .

Organic chemistry reactions are used in a wide range of applications, from the synthesis of new drugs and materials to the production of food and fuel. For example, organic chemistry reactions are used to synthesize aspirin, which is a common pain reliever, and to produce ethanol, which is used as a fuel additive .

Organic chemistry reactions can also be used to study the properties of organic compounds. For example, chemists can use organic chemistry reactions to determine the structure of a compound by analyzing the products of a reaction. This information can then be used to identify unknown compounds or to study the properties of known compounds .

In conclusion, Organic Chemistry Reactions 20 is a vast topic that covers a wide range of chemical reactions involving organic compounds. Understanding the mechanisms behind these reactions is essential for predicting the outcome of a reaction and for designing new reactions. Organic chemistry reactions are used in a wide range of applications, from the synthesis of new drugs and materials to the production of food and fuel. They are also used to study the properties of organic compounds and to identify unknown compounds.

Organic Chemistry Reactions 20

Male Radar Powerpoint

Male Radar PowerPoint is a free template that can be used in PowerPoint or Google Slides. It features a man’s head silhouette with a radar chart in place of the brain. The radar chart has eight variables or aspects, which can be customized to suit your needs. The template is designed to represent the importance of the brain, which is associated with many concepts such as knowledge, thoughts, ideas, brainstorming, and network. The template is available in two slide option designs: Standard (4:3) and Widescreen (16:9). The shapes are 100% editable, and colors and sizes can be easily changed. The template uses a selection of editable PowerPoint icons and is available in PPTX file format for both Standard (4:3) and Widescreen (16:9) aspect ratios. The template is free for personal and educational use, but requires attribution. Commercial use, resell, and redistribution are allowed. The template uses the Helvetica and Calibri fonts, which are system fonts .

Male Radar Powerpoint

Butterfly Diagram

Butterflies are a type of insect belonging to the order Lepidoptera, which also includes moths. They are characterized by their large, often brightly colored wings that fold together when at rest, and a conspicuous, fluttering flight. The oldest butterfly fossils have been dated to the Paleocene, about 56 million years ago, though they may have originated earlier. Butterflies have a four-stage life cycle, as like other holometabolan insects they undergo complete metamorphosis. Winged adults lay eggs on the food plant on which their larvae, known as caterpillars, will feed. The caterpillars grow, sometimes very rapidly, and when fully developed, pupate in a chrysalis. When metamorphosis is complete, the pupal skin splits, the adult insect climbs out, expands its wings to dry, and flies off.

Butterflies are often polymorphic, and many species make use of camouflage, mimicry, and aposematism to evade their predators. Some, like the monarch and the painted lady, migrate over long distances. Many butterflies are attacked by parasites or parasitoids, including wasps, protozoans, flies, and other invertebrates, or are preyed upon by other organisms. Some species are pests because in their larval stages they can damage domestic crops or trees; other species are agents of pollination of some plants. Larvae of a few butterflies (e.g., harvesters) eat harmful insects, and a few are predators of ants, while others live as mutualists in association with ants.

Culturally, butterflies are a popular motif in the visual and literary arts. They are often associated with beauty, freedom, and transformation. In art, they are often depicted in paintings, sculptures, and other forms of visual art. In literature, they are often used as symbols of transformation, rebirth, and hope. Butterflies are also used in various cultural practices, such as in the Day of the Dead celebrations in Mexico, where they are believed to represent the souls of the deceased.

In conclusion, butterflies are fascinating insects that have captured the imagination of people for centuries. They are known for their beautiful wings, their unique life cycle, and their important ecological roles. They are also important cultural symbols that have been used in art, literature, and various cultural practices around the world..

Butterfly Diagram

What Happened In The 1800s

The 1800s was a century of significant change and progress in many parts of the world. The Industrial Revolution, which began in the late 1700s, continued to transform the economies of Europe and North America, leading to the growth of factories, railroads, and other technological advancements. In the United States, the 1800s saw the country expand westward, with the Louisiana Purchase in 1803 doubling the size of the country. The Civil War, which took place in the middle of the century, challenged the idea of “manifest destiny” and left the nation teetering on the edge of complete fracture. The 1800s were also a time of great intellectual and technical progress, with many people acquiring astonishing economic gains.

In Europe, the 1800s saw the rise of the Industrial Revolution, which brought about significant economic growth and urbanization. The population of major countries increased between 50 and 100 percent, chiefly as a result of the use of new food crops such as the potato and a temporary decline in epidemic disease. This population growth compelled change, and the social structure changed toward a basic division between owners and non-owners. Production expanded, leading by the end of the 18th century to a first wave of consumerism as rural wage earners began to purchase new kinds of commercially produced clothing, while urban middle-class families began to indulge in new tastes, such as uplifting books and educational toys for children. In this context, an outright industrial revolution took shape, led by Britain, which retained leadership in industrialization well past the middle of the 19th century.

In Africa, the 1800s saw immense changes, with some driven by famine and disease, and others by the territorial ambitions of African rulers. As the century progressed, alliances with merchants and missionaries from Europe began increasingly to have a bearing on how African leaders achieved their goals. In South Africa, the 1800s saw the rise of the British Empire, with the British occupying the Cape for a second time in 1806. The formal

What Happened In The 1800s

Mass Movement Geography

Mass movement, also known as mass wasting, refers to the bulk movements of soil and rock debris down slopes in response to the pull of gravity, or the rapid or gradual sinking of the Earth’s ground surface in a predominantly vertical direction. The term mass movement has been substituted to include mass wasting processes and the sinking of confined areas of the Earth’s ground surface. Mass movements on slopes and sinking mass movements are often aided by water and the significance of both types is the part each plays in the alteration of landforms.

The variety of downslope mass movements reflects the diversity of factors that are responsible for their origin. Such factors include: weathering or erosional debris cover on slopes, which is usually liable to mass movement; the character and structure of rocks, such as resistant permeable beds prone to sliding because of underlying impermeable rocks; the removal of the vegetation cover, which increases the slope’s susceptibility to mass movement by reducing its stability; artificial or natural increases in the slope’s steepness, which will usually induce mass movement; earthquake tremors, which affect the slope equilibrium and increase the likelihood of mass movement; and flowing ground water, which exerts pressure on soil particles and impairs slope stability.

The types of mass movements caused by the above factors include: the abrupt movement and free fall of loosened blocks of solid rock, known as rockfalls; several types of almost imperceptible downslope movement of surficial soil particles and rock debris, collectively called creep; the subsurface creep of rock material, known as bulging: the multiplicity of downslope movements of bedrock and other debris caused by the separation of a slope section along a plane of least resistance or slip surface, collectively called landslides; the separation of a mass along a concave head scarp, moving down a curved slip surface and accumulating at the slope’s foot, known as a slump; the saturation of debris and weathered material by rainfall in the upper section of a slope or valley, increasing the weight of the debris and causing a slow downslope movement, called an earthflow; a rapidly moving earthflow possessing a higher water content, known as a mudflow; a fast-moving earthflow in a mountainous region, called a debris flow or avalanche; and the downslope movement of moisture-saturated surficial material, known as solifluction, over frozen substratum material, occurring in sub-Arctic regions during seasonal periods of surface thaw.

The study of mass movement is important in understanding the geological processes that shape the Earth’s surface. It is also important in assessing the risks of natural disasters such as landslides, mudflows, and avalanches. The knowledge of mass movement is used in engineering, construction, and urban planning to design structures that can withstand the forces of mass movement. The study of mass movement is also important in the field of environmental science, as it helps in understanding the impact of human activities on the environment and the potential for natural disasters.

In conclusion, mass movement is a geological process that involves the downslope movement of soil and rock debris in response to gravity. The types of mass movements are diverse and are caused by a variety of factors. The study of mass movement is important in understanding the geological processes that shape the Earth’s surface and in assessing the risks of natural disasters. It is also important in engineering, construction, urban planning, and environmental science..

Mass Movement Geography

Simple Timeline Template Powerpoint

A simple timeline template PowerPoint is a tool that helps you create and present a visual representation of a sequence of events, milestones, or tasks in a chronological order. A timeline can be used for various purposes, such as:

– Showing the progress or status of a project, program, or plan
– Communicating the key phases, deliverables, or deadlines of a project, program, or plan
– Highlighting the major achievements, events, or changes in a history, biography, or story
– Comparing or contrasting different timelines or scenarios
– Simplifying complex or detailed information into a clear and concise overview

A simple timeline template PowerPoint usually consists of the following elements:

– A horizontal or vertical line that represents the time scale or duration of the timeline
– A series of shapes, icons, or labels that mark the important points or events on the timeline
– A text box or a callout that provides additional information or details about each point or event
– A title or a legend that explains the purpose, scope, or theme of the timeline

There are many benefits of using a simple timeline template PowerPoint, such as:

– It saves you time and effort by providing you with a ready-made and customizable layout and design for your timeline
– It enhances your presentation by adding visual appeal, clarity, and professionalism to your timeline
– It improves your communication by making your timeline easy to understand, follow, and remember for your audience
– It supports your argument or message by showing the logical flow, sequence, or connection of your timeline

There are also some challenges or limitations of using a simple timeline template PowerPoint, such as:

– It may not be suitable for complex or detailed timelines that require more space, flexibility, or interactivity
– It may not be compatible with different versions, formats, or platforms of PowerPoint or other presentation software
– It may not reflect your personal style, preference, or branding if you use a generic or standard template
– It may not be accurate or up-to-date if you do not update or revise your timeline regularly or as needed

To create a simple timeline template PowerPoint, you can follow these steps:

– Choose a template that matches your purpose, audience, and content. You can use the free timeline templates from [Office Timeline](^1^), [Microsoft Create](^2^), [24Slides](^4^), or [PresentationGO](^5^), or you can create your own template from scratch.
– Edit the template to suit your needs. You can change the color, style, size, or position of the line, shapes, icons, labels, text boxes, or callouts. You can also add, delete, or rearrange the points or

Simple Timeline Template Powerpoint