According to the 2021 Census conducted by Statistics Canada, the Canadian population is made up of various generations of different sizes, and each influences society according to their world view, characteristics, values and stage in their life cycle. The following table shows the percentage of the Canadian population by generation:
| Generation | Age Range | Percentage of Population |
|—————-|————–|——————————|
| Generation Alpha | 8 or younger | 5.8% |
| Generation Z | 9 – 24 | 18.2% |
| Millennials | 25 – 40 | 21.4% |
| Generation X | 41 – 55 | 19.1% |
| Baby Boomers | 56 – 75 | 24.9% |
| Interwar Generation | 76 – 93 | 7.3% |
The baby boomer generation, born between 1946 and 1965, make up less than a quarter of the Canadian population for the first time since the end of the baby boom. They represent 24.9% of the Canadian population, compared with 41.7% in 1966, when they were under the age of 20. Millennials, who are those born between 1981 and 1996, are the fastest-growing generation. Their numbers rose 8.6% between 2016 and 2021. They account for the largest share of the working-age population (33.2%), or those aged 15 to 64.
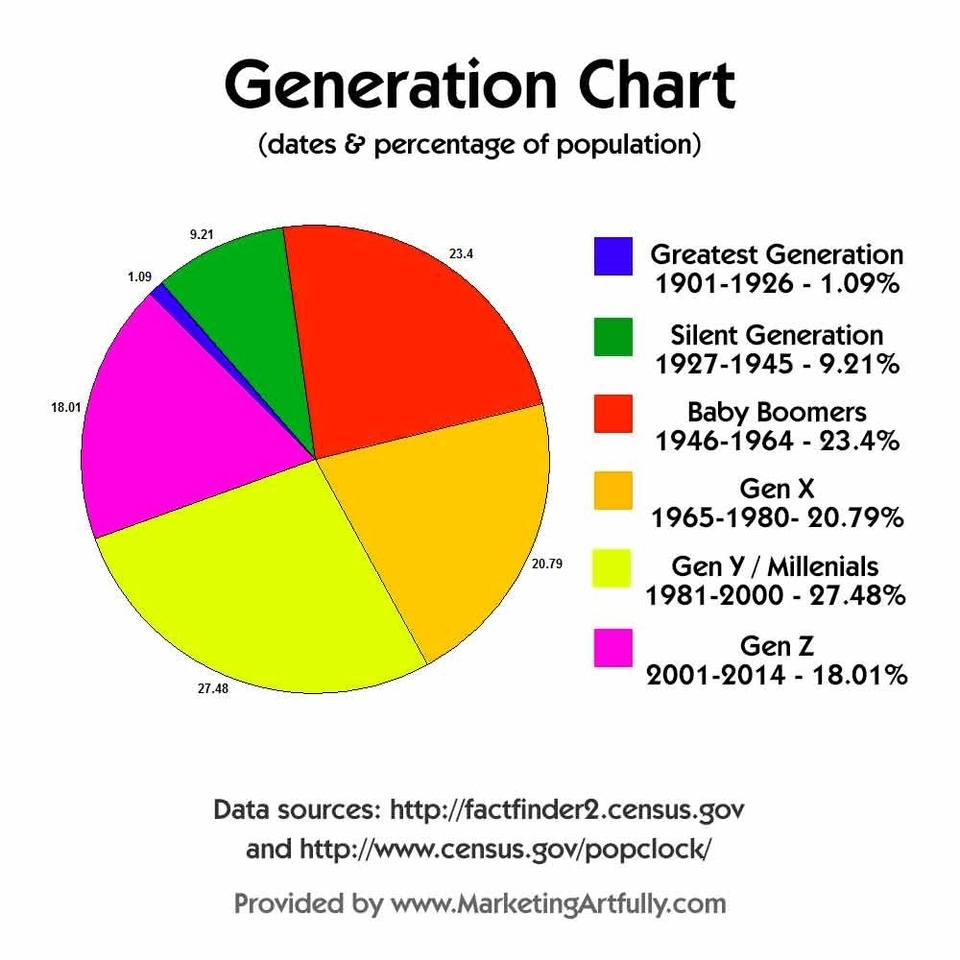
In the United States, the 2021 Census conducted by the US Census Bureau shows that the population is divided into the following generations:
| Generation | Birth Year | Age Range |
|—————-|—————-|—————|
| Generation Alpha | 2013 – present | 0 – 8 |
| Generation Z | 1997 – 2012 | 9 – 24 |
| Millennials | 1981 – 1996 | 25 – 40 |
| Generation X | 1965 – 1980 | 41 – 56 |
| Baby Boomers | 1946 – 1964