Skip to content
cropped logo

Ygraph

Charts, Graphs and Diagrams

Menu

Primary menu

  • Submit Diagram
  • Science
  • Business
  • Economy
    • GDP
  • Demographics
  • Explained
    • Signs
    • Maps
  • Health
  • Anatomy
  • Sizes

Bronfrenbrenner bioecological model

Bronfrenbrenner bioecological model

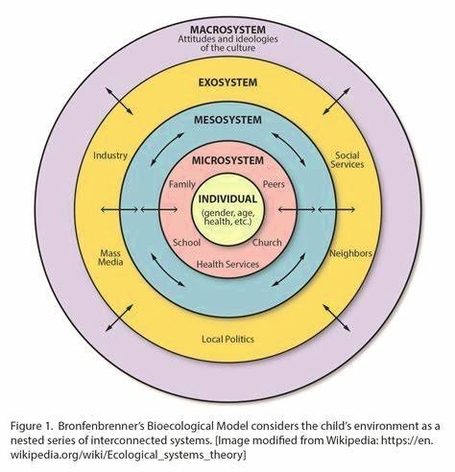
Bronfenbrenner bioecological model: The Bronfenbrenner bioecological model emphasizes the complex interactions between an individual and their environment, structured into five systems

bioecological model diagram, Bronfenbrenner theory explained, child development framework, ecological systems model, systems theory psychology

Post navigation

← Previous Previous post: Government Executive Hierarchy
Next → Next post: Cyprus Population

Primary Sidebar Widget Area

Top Diagrams

Latest Posts

  • How to Stop Time from Flying
  • Mongolia Population
  • Computer Science Diagram
  • Physics Definition, Branches And Importance
  • Gibraltar Births per woman
  • Botswana Population
  • R Venn Diagram
  • Geographic Information System
  • Oman Population
  • Central Europe and the Baltics Births per woman
  • Baby Clothes Size Chart
  • how to deal with preteen.jpg
  • Political View Chart Illustrated
  • Brain Structure Described In Detail
  • Croatia Births per woman
  • Human Health Diagram Explained

Top Tags

  • sizes (35)
  • size chart (35)
  • size conversion (35)
  • economy chart (33)
  • economy graph (33)
  • economy diagram (33)
  • cell (29)
  • cell diagram (29)
  • cell illustration (29)
  • window (24)
  • window diagram (24)
  • types of windows (24)
  • origami (16)
  • origami steps (16)
  • how to make origami (16)
  • biology (16)
  • biology diagram (16)
  • yoga (8)
  • yoga routine (8)
  • yoga poses (8)

Categories

  • anatomy
  • Business
  • chart
  • Demographics
  • Eco
  • Ecom
  • Economy
  • Explained
  • GDP
  • Health
  • Maps
  • notice
  • science
  • Signs
  • Sizes
  • Uncategorized

Useful Resources

  • Chart Diagram
  • Meme Gif
  • Logo Sign
  • Human Anatomy
  • Graph Diagram
  • Economy GDP
  • Twitter
Copyright © 2026 Ygraph. All Rights Reserved.
Theme: Catch Box by Catch Themes
Scroll Up
WP Twitter Auto Publish Powered By : XYZScripts.com