History
– Science
– Literature
– Art
– Music
– Sports
– Technology
– Culture
– Philosophy
– Personal experiences
Charts, Graphs and Diagrams
History
– Science
– Literature
– Art
– Music
– Sports
– Technology
– Culture
– Philosophy
– Personal experiences
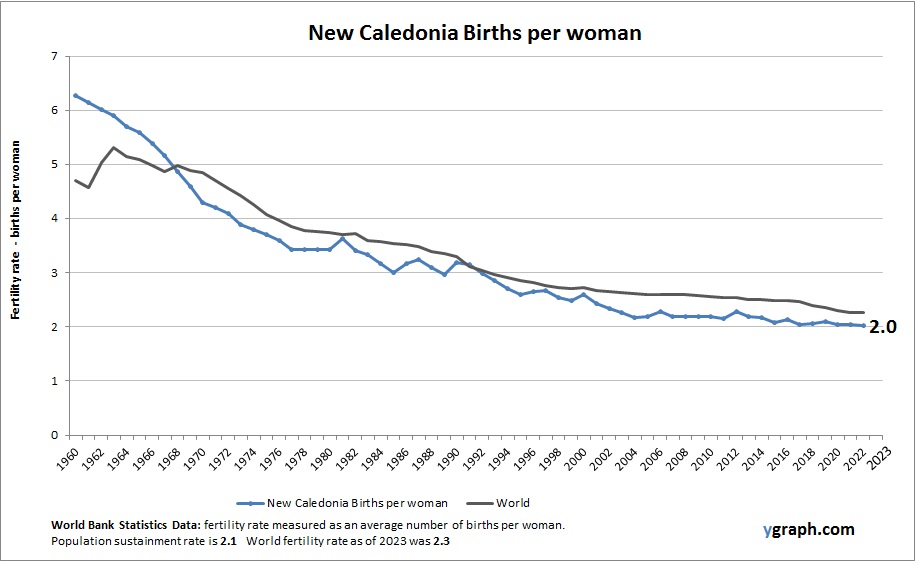
Chart above demonstrates New Caledonia Births per woman. The fertility rate statistics are compiled by World Bank. Based on the latest demographics info provided for New Caledonia.
New Caledonia exhibits moderate fertility rates with gradual declines linked to urbanization and socioeconomic development. Population growth is steady, supported by a relatively young population and migration within the Pacific region.
Political Spectrum: The political spectrum is a system for classifying political positions, ideologies, and parties. It ranges from left-wing, advocating for social equality and government intervention, to right-wing, emphasizing individualism and limited government.
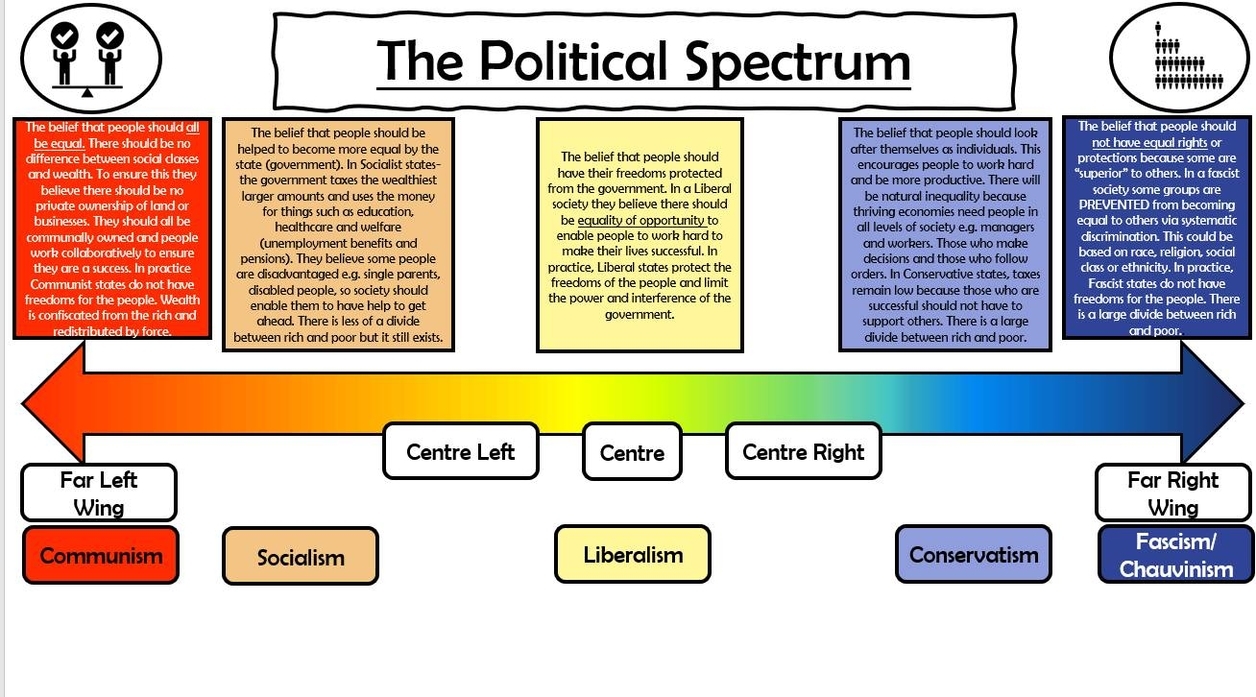
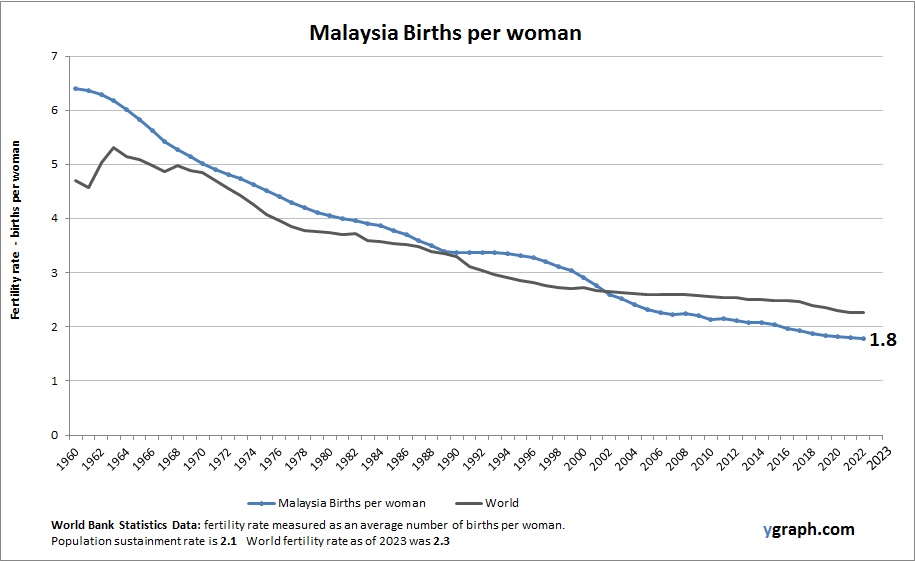
Chart above demonstrates Malaysia Births per woman. This is according to World Bank birth stats by country. Based on the latest available information for Malaysia.
Malaysias fertility rate has been declining steadily, now sitting below the replacement level. Economic development, urban living, and greater educational and career opportunitiesespecially for womenhave contributed to this decline, reshaping the countrys long-term demographic outlook.
Filter Funnel Diagram: A filter funnel diagram illustrates the process of filtration, showing how a mixture is poured through a funnel containing filter paper. The solid particles are trapped by the filter paper, while the liquid passes through, demonstrating the separation of components.

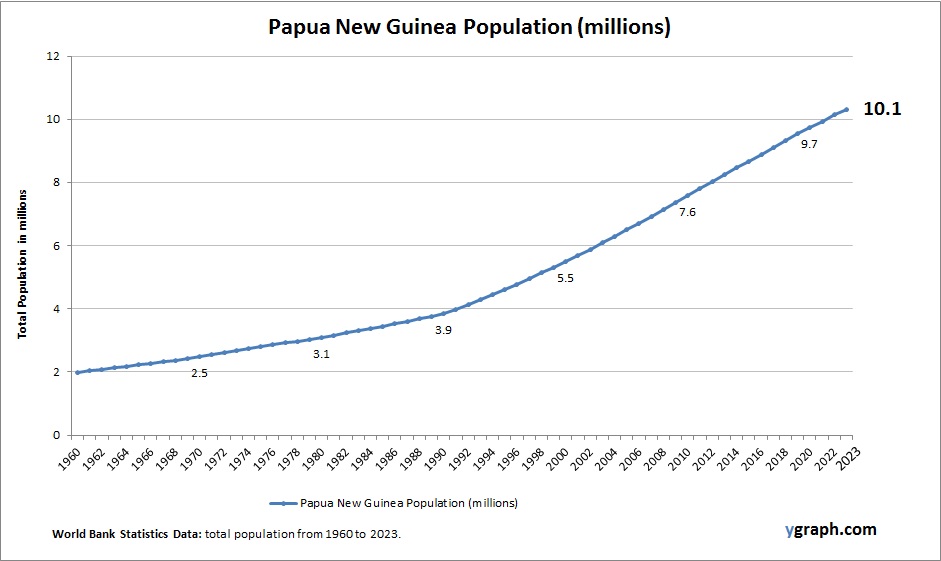
The above graph shows Papua New Guinea Population. This is according to World Bank total population stats. Based on the latest available information for Papua New Guinea.
Papua New Guinea has a rapidly growing population fueled by high fertility rates and a predominantly rural lifestyle. The countrys diverse cultures and geographic challenges complicate access to healthcare and education, particularly in remote regions. Population growth exerts pressure on infrastructure and natural resources, while urban areas see increasing migration from rural districts, shaping the nations demographic landscape.
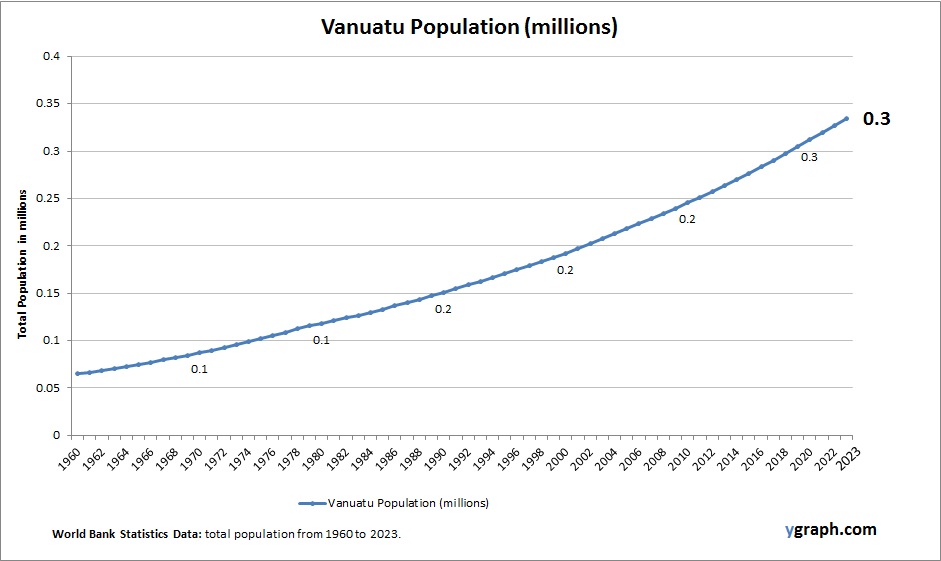
The above graph shows Vanuatu Population. This is according to World Bank total population stats. Latest population information for Vanuatu.
Vanuatus population is growing moderately, supported by high fertility rates and a predominantly rural lifestyle. The country faces challenges related to infrastructure, healthcare access, and vulnerability to natural disasters, which influence demographic trends. Urban migration is gradually increasing.
Scientific Diagrams Example: Scientific diagrams are visual representations used to explain scientific concepts, processes, or structures. Examples include the water cycle diagram, illustrating the movement of water through the environment, and the cell diagram, showing the components of a cell.
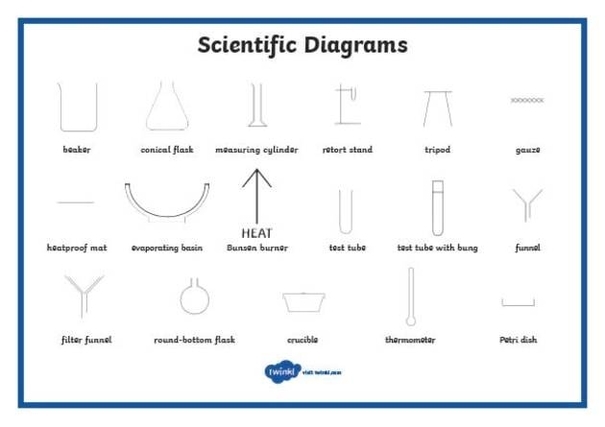
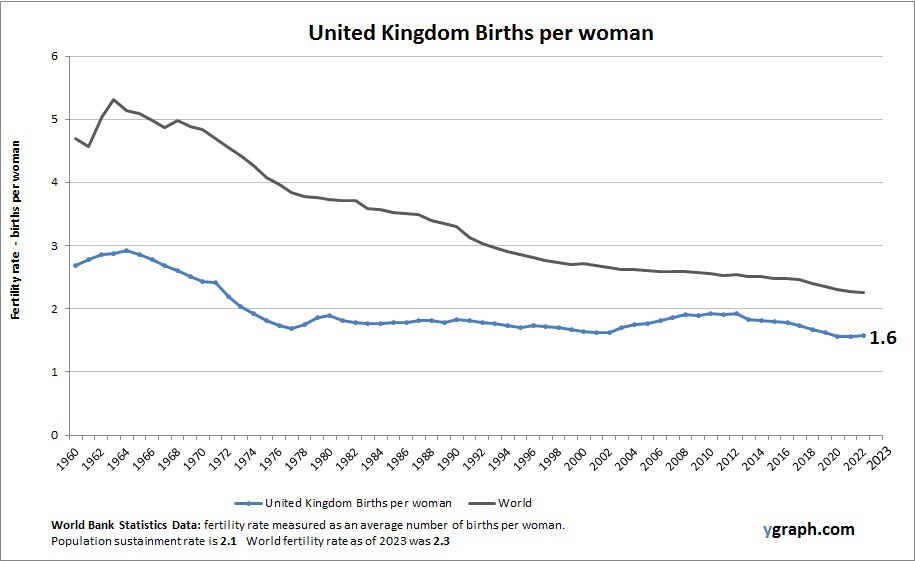
Chart above demonstrates United Kingdom Births per woman. This is according to World Bank birth stats by country. Latest births per woman information for United Kingdom.
The United Kingdom has fertility rates slightly below replacement level, influenced by socioeconomic factors such as delayed childbearing and career prioritization. Immigration helps offset population decline, while government policies support families through childcare and parental leave schemes.
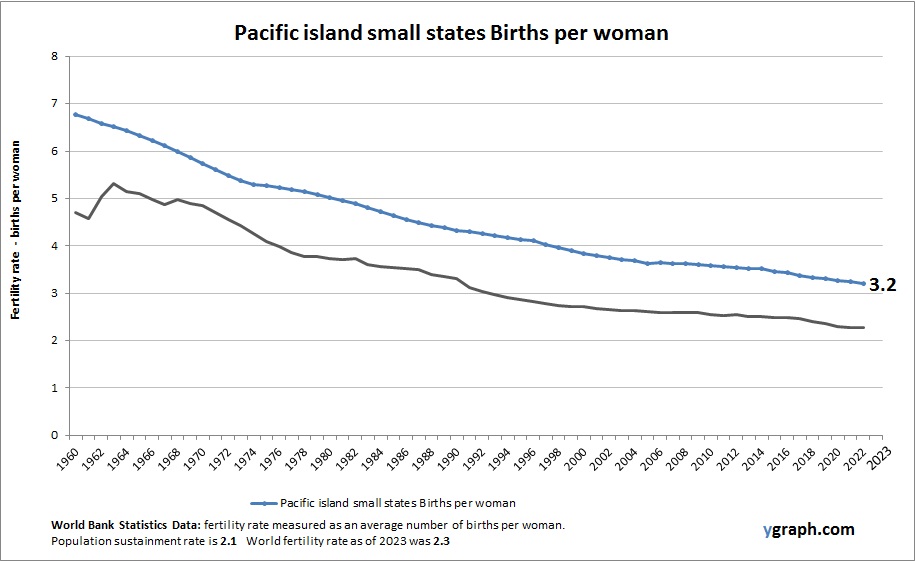
The above graph shows Pacific island small states Births per woman. World Bank is the source of this birth data. Based on the latest demographics info provided for Pacific island small states.
Fertility rates among Pacific island small states vary but tend to be higher than global averages. Cultural norms, limited access to family planning, and rural lifestyles contribute to higher birth rates, though urbanization and modernization are gradually shifting reproductive behavior.