Scientific Diagram Drawing: Scientific diagram drawing involves creating accurate and detailed visual representations of scientific concepts, experiments, and data. These diagrams aid in understanding and communicating complex information.

Charts, Graphs and Diagrams
Scientific Diagram Drawing: Scientific diagram drawing involves creating accurate and detailed visual representations of scientific concepts, experiments, and data. These diagrams aid in understanding and communicating complex information.
This diagram presents Russia Births per woman. This is according to World Bank birth stats by country. Based on the latest available information for Russia.
Russia’s fertility rate is below replacement and has been declining again in recent years despite government efforts to boost it. Demographic concerns are exacerbated by aging, declining life expectancy in some regions, and net population loss due to emigration.

Speech sounds are the building blocks of language and are essential for effective communication. Here are some of the most common speech sounds that children learn:
1. /p/: This sound is produced by closing the lips together and then releasing them to create a small explosion of air. Examples of words that contain this sound include “pat,” “pen,” and “pig.”
2. /b/: This sound is similar to /p/ but is voiced, meaning that the vocal cords vibrate when producing the sound. Examples of words that contain this sound include “bat,” “boy,” and “big.”
3. /m/: This sound is produced by closing the lips together and then releasing them while also vibrating the vocal cords. Examples of words that contain this sound include “mom,” “man,” and “me.”
4. /n/: This sound is produced by placing the tongue behind the upper teeth and then releasing it while also vibrating the vocal cords. Examples of words that contain this sound include “no,” “now,” and “nice.”
5. /t/: This sound is produced by placing the tongue behind the upper teeth and then releasing it to create a small explosion of air. Examples of words that contain this sound include “top,” “ten,” and “tall.”
6. /d/: This sound is similar to /t/ but is voiced, meaning that the vocal cords vibrate when producing the sound. Examples of words that contain this sound include “dog,” “dad,” and “day.”
7. /k/: This sound is produced by closing the back of the tongue against the soft palate and then releasing it to create a small explosion of air. Examples of words that contain this sound include “cat,” “kite,” and “kid.”
8. /g/: This sound is similar to /k/ but is voiced, meaning that the vocal cords vibrate when producing the sound. Examples of words that contain this sound include “go,” “girl,” and “give.”
9. /f/:

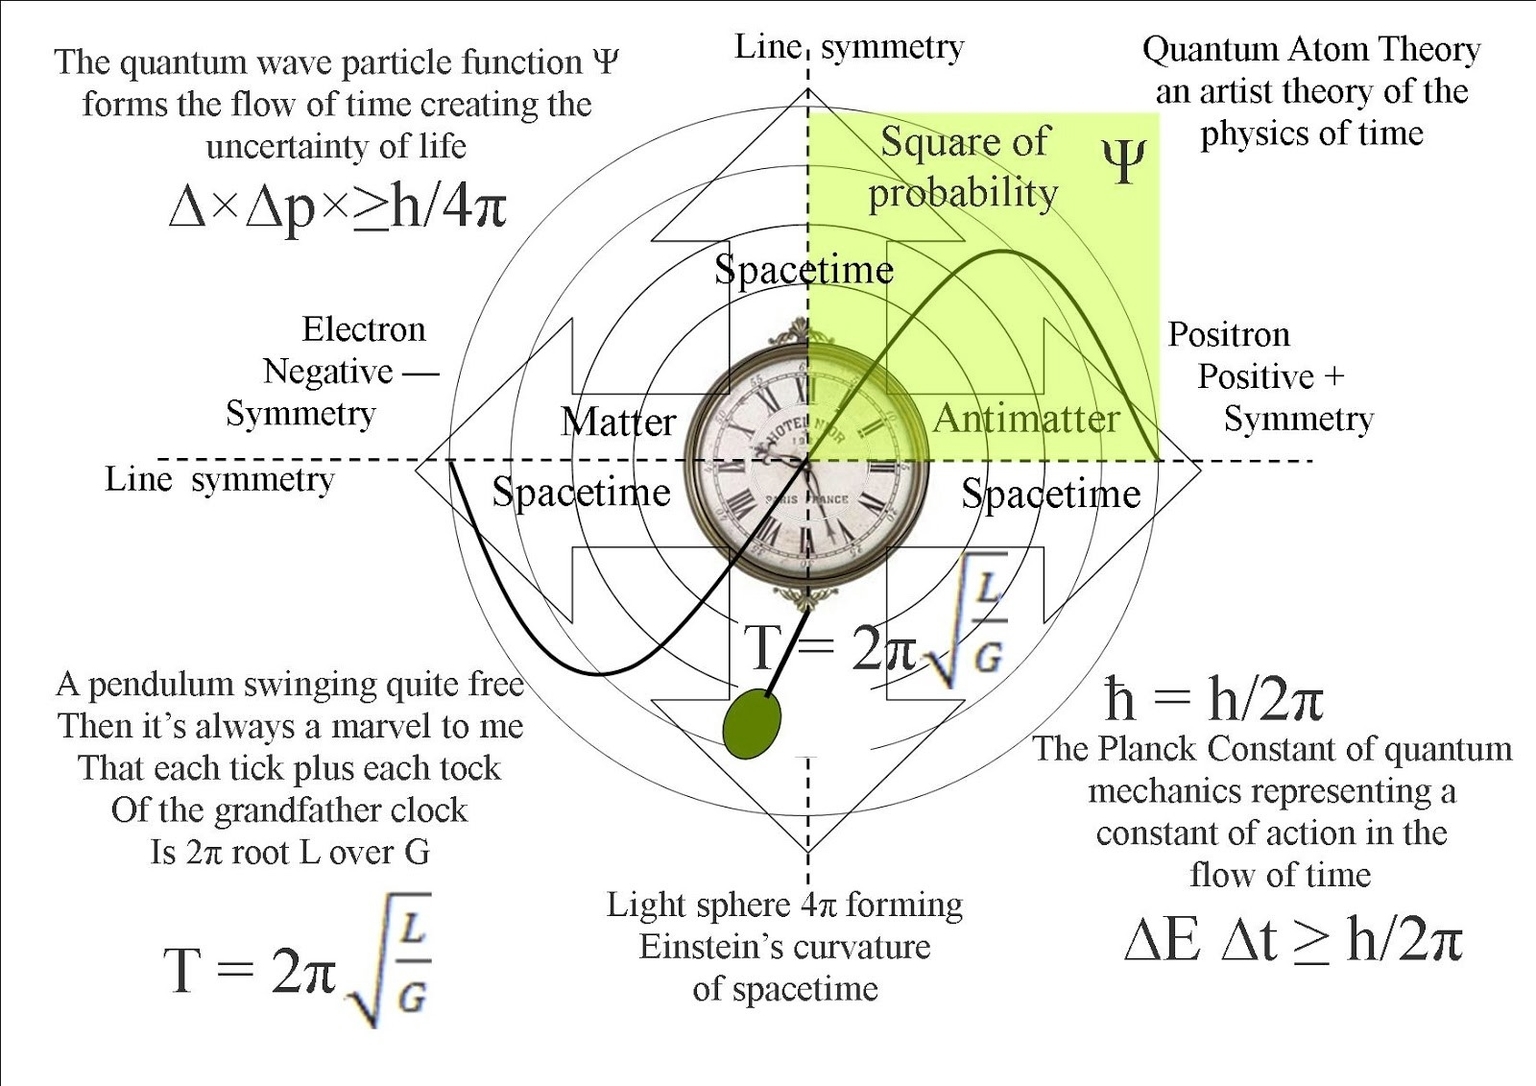
Quantum Physics 18 is not a well-defined term, but it could refer to one of the following topics:
– A course on quantum physics that covers the basic features of quantum mechanics, such as wave-particle duality, Schrödinger’s equation, uncertainty principle, and quantum numbers.
– A unit on quantum physics from a physics library that introduces the mathematical postulates of quantum mechanics, the qubit, quantum measurement, quantum operations, and observables.
– A collection of quantum physics discoveries and projects from the year 2018, such as quantum data storage, quantum entanglement, quantum teleportation, and quantum computing.
Quantum physics is the branch of physics that studies the behavior of matter and energy at the smallest scales, where the classical laws of physics break down and new phenomena emerge. Quantum physics reveals that the physical world is not deterministic, but probabilistic, and that physical properties can exist in superposition or entanglement. Quantum physics also provides the foundation for many modern technologies, such as lasers, semiconductors, and nuclear power.
Quantum physics is one of the most fascinating and challenging fields of science, as it challenges our common sense and intuition, and opens up new possibilities for exploration and innovation. If you are interested in learning more about quantum physics, you can check out some online resources, such as [Khan Academy](^1^), [University of Waterloo](^2^), [Live Science](^3^), [MIT OpenCourseWare](^4^), and [Coursera](^5^)..
The above graph shows US Virgin Islands Population. This is according to World Bank total population stats. Latest population information for US Virgin Islands.
The US Virgin Islands have a small population experiencing slow growth, shaped by moderate birth rates and migration trends. Economic activities centered on tourism and services influence demographic patterns.
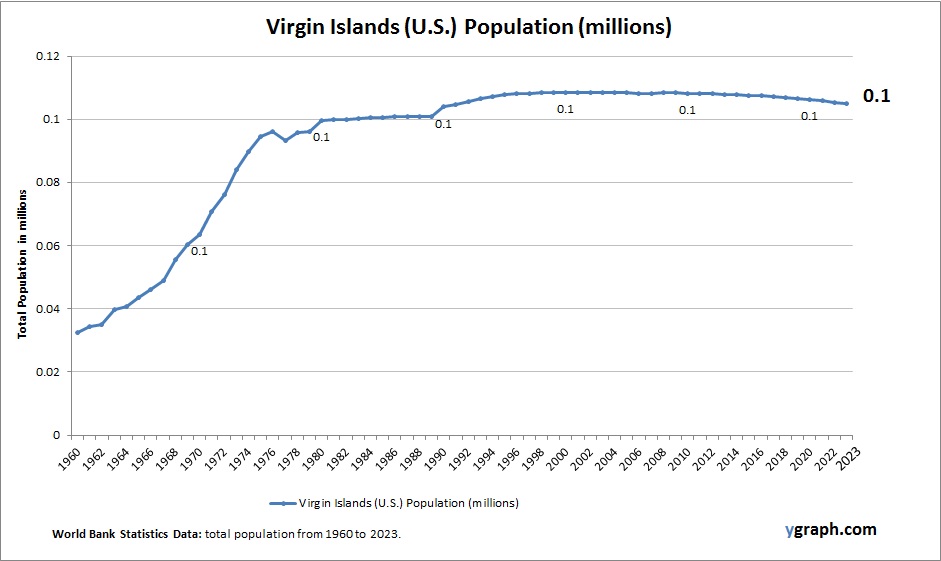
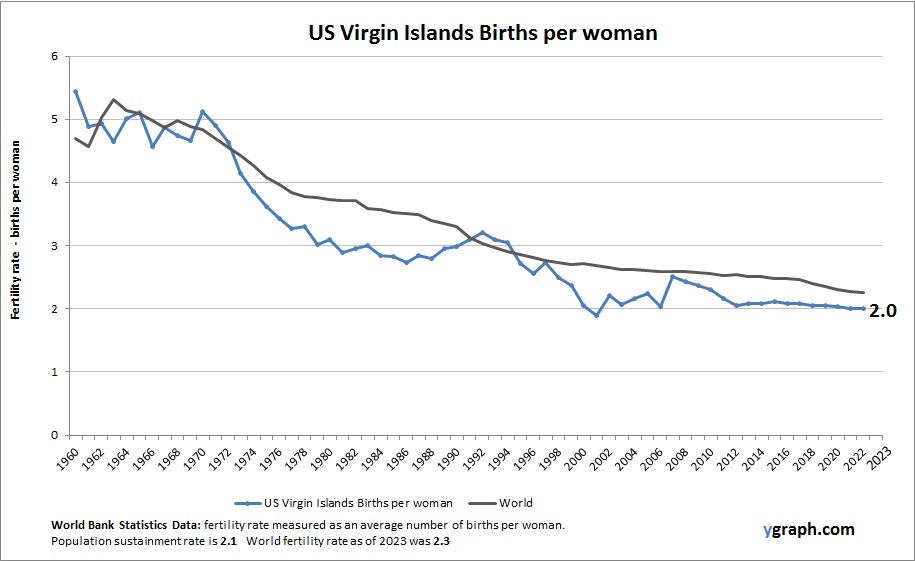
Chart above demonstrates US Virgin Islands Births per woman. World Bank is the source of this birth data. Based on the latest demographics info provided for US Virgin Islands.
The US Virgin Islands have low to moderate fertility rates influenced by economic factors, healthcare access, and social changes. Population growth is slow, with migrationboth emigration and immigrationplaying significant roles. Tourism-driven economies impact demographic patterns and family life.
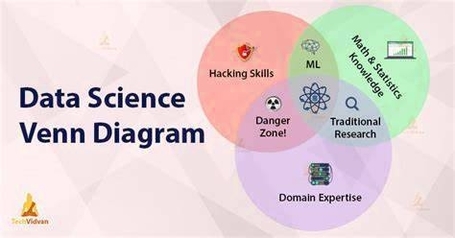
Data Science Venn Diagram: A data science Venn diagram illustrates the intersection of three key areas
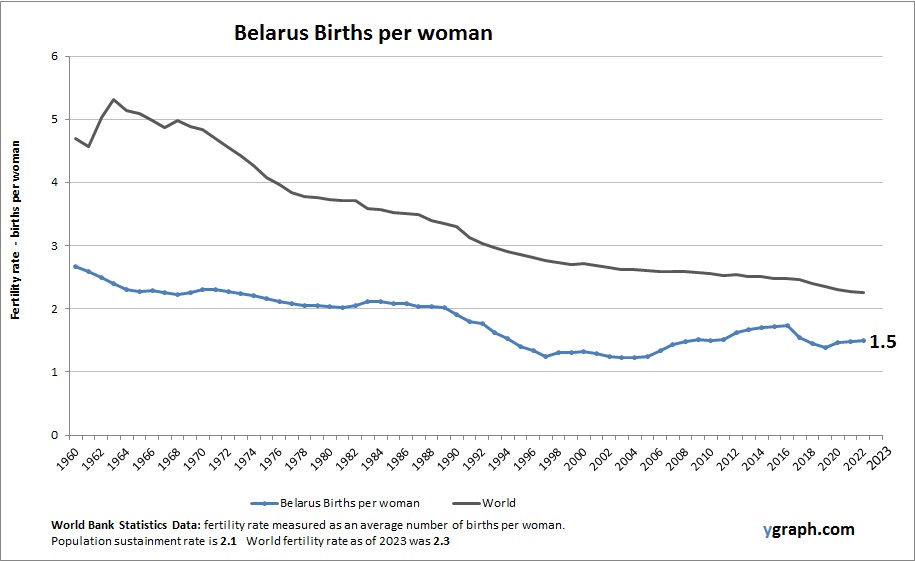
The above graph shows Belarus Births per woman. World Bank is the source of this birth data. Based on the latest available information for Belarus.
Belarus has low fertility rates well below replacement level, contributing to population decline and demographic aging. Economic uncertainty and emigration exacerbate these trends, prompting government initiatives to encourage childbearing and support families. Urbanization is high, with a concentration of population in Minsk and other cities, shaping social and economic life.
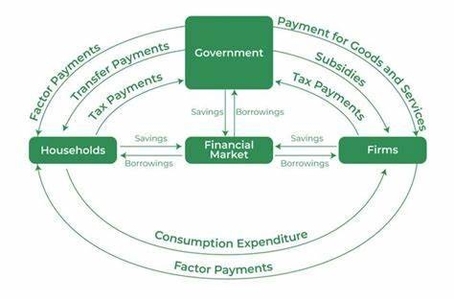
What Is Circular Flow Of Income: The circular flow of income is an economic model illustrating the flow of goods, services, and money between households and firms. It shows how income circulates through the economy, supporting production and consumption.
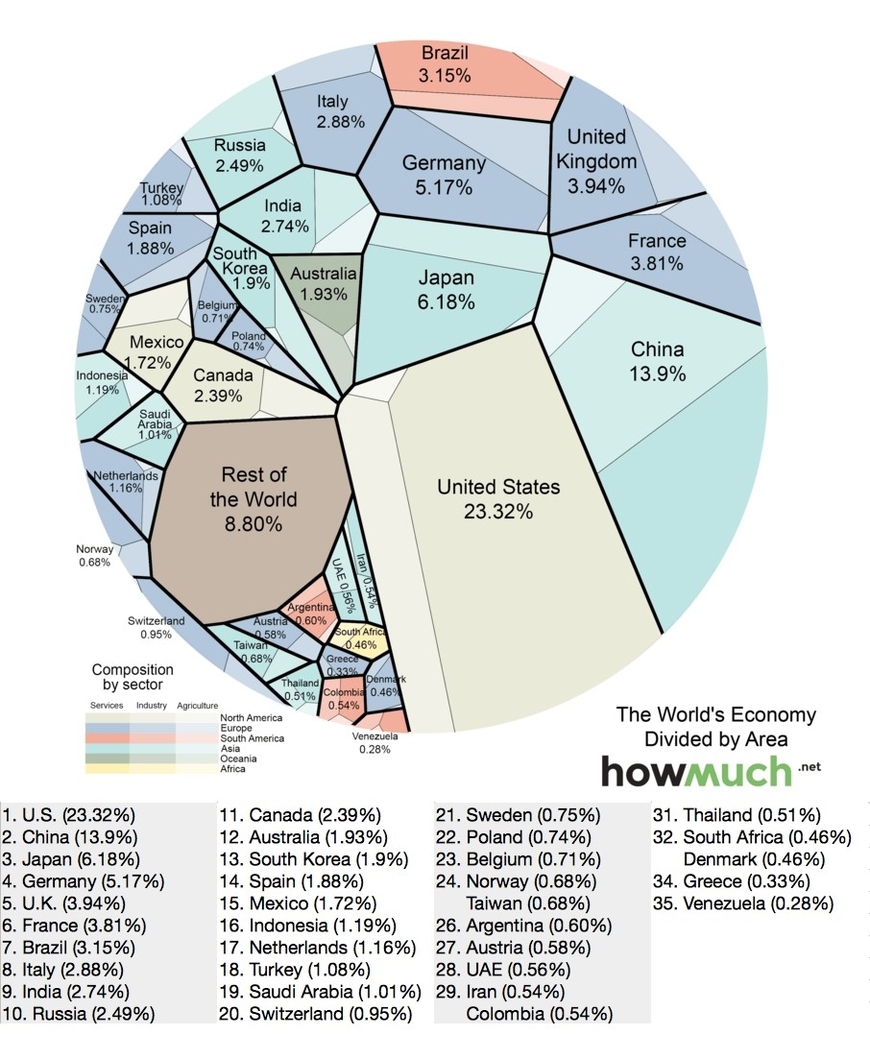
The Gross Domestic Product (GDP) is a measure of the total value of goods and services produced by a country in a given year. It is one of the most important indicators of a country’s economic performance. According to the International Monetary Fund (IMF), the world’s nominal GDP in 2023 was estimated to be around $118.7 trillion. The United States, China, and Japan are the top three economies in the world, with nominal GDPs of $28.8 trillion, $22.5 trillion, and $5.2 trillion, respectively .
The following table shows the top 10 countries by nominal GDP in 2023, according to the IMF:
| Rank | Country | Nominal GDP (in trillions of USD) |
|———-|————-|————————————–|
| 1 | United States | 28.8 |
| 2 | China | 22.5 |
| 3 | Japan | 5.2 |
| 4 | Germany | 4.9 |
| 5 | United Kingdom | 3.2 |
| 6 | India | 3.1 |
| 7 | France | 2.9 |
| 8 | Italy | 2.3 |
| 9 | Brazil | 2.2 |
| 10 | Canada | 1.8 |
It is worth noting that nominal GDP does not take into account differences in the cost of living in different countries, and the results can vary greatly from one year to another based on fluctuations in the exchange rates of the country’s currency . Therefore, comparisons of national wealth are also frequently made on the basis of purchasing power parity (PPP), to adjust for differences in the cost of living in different countries .