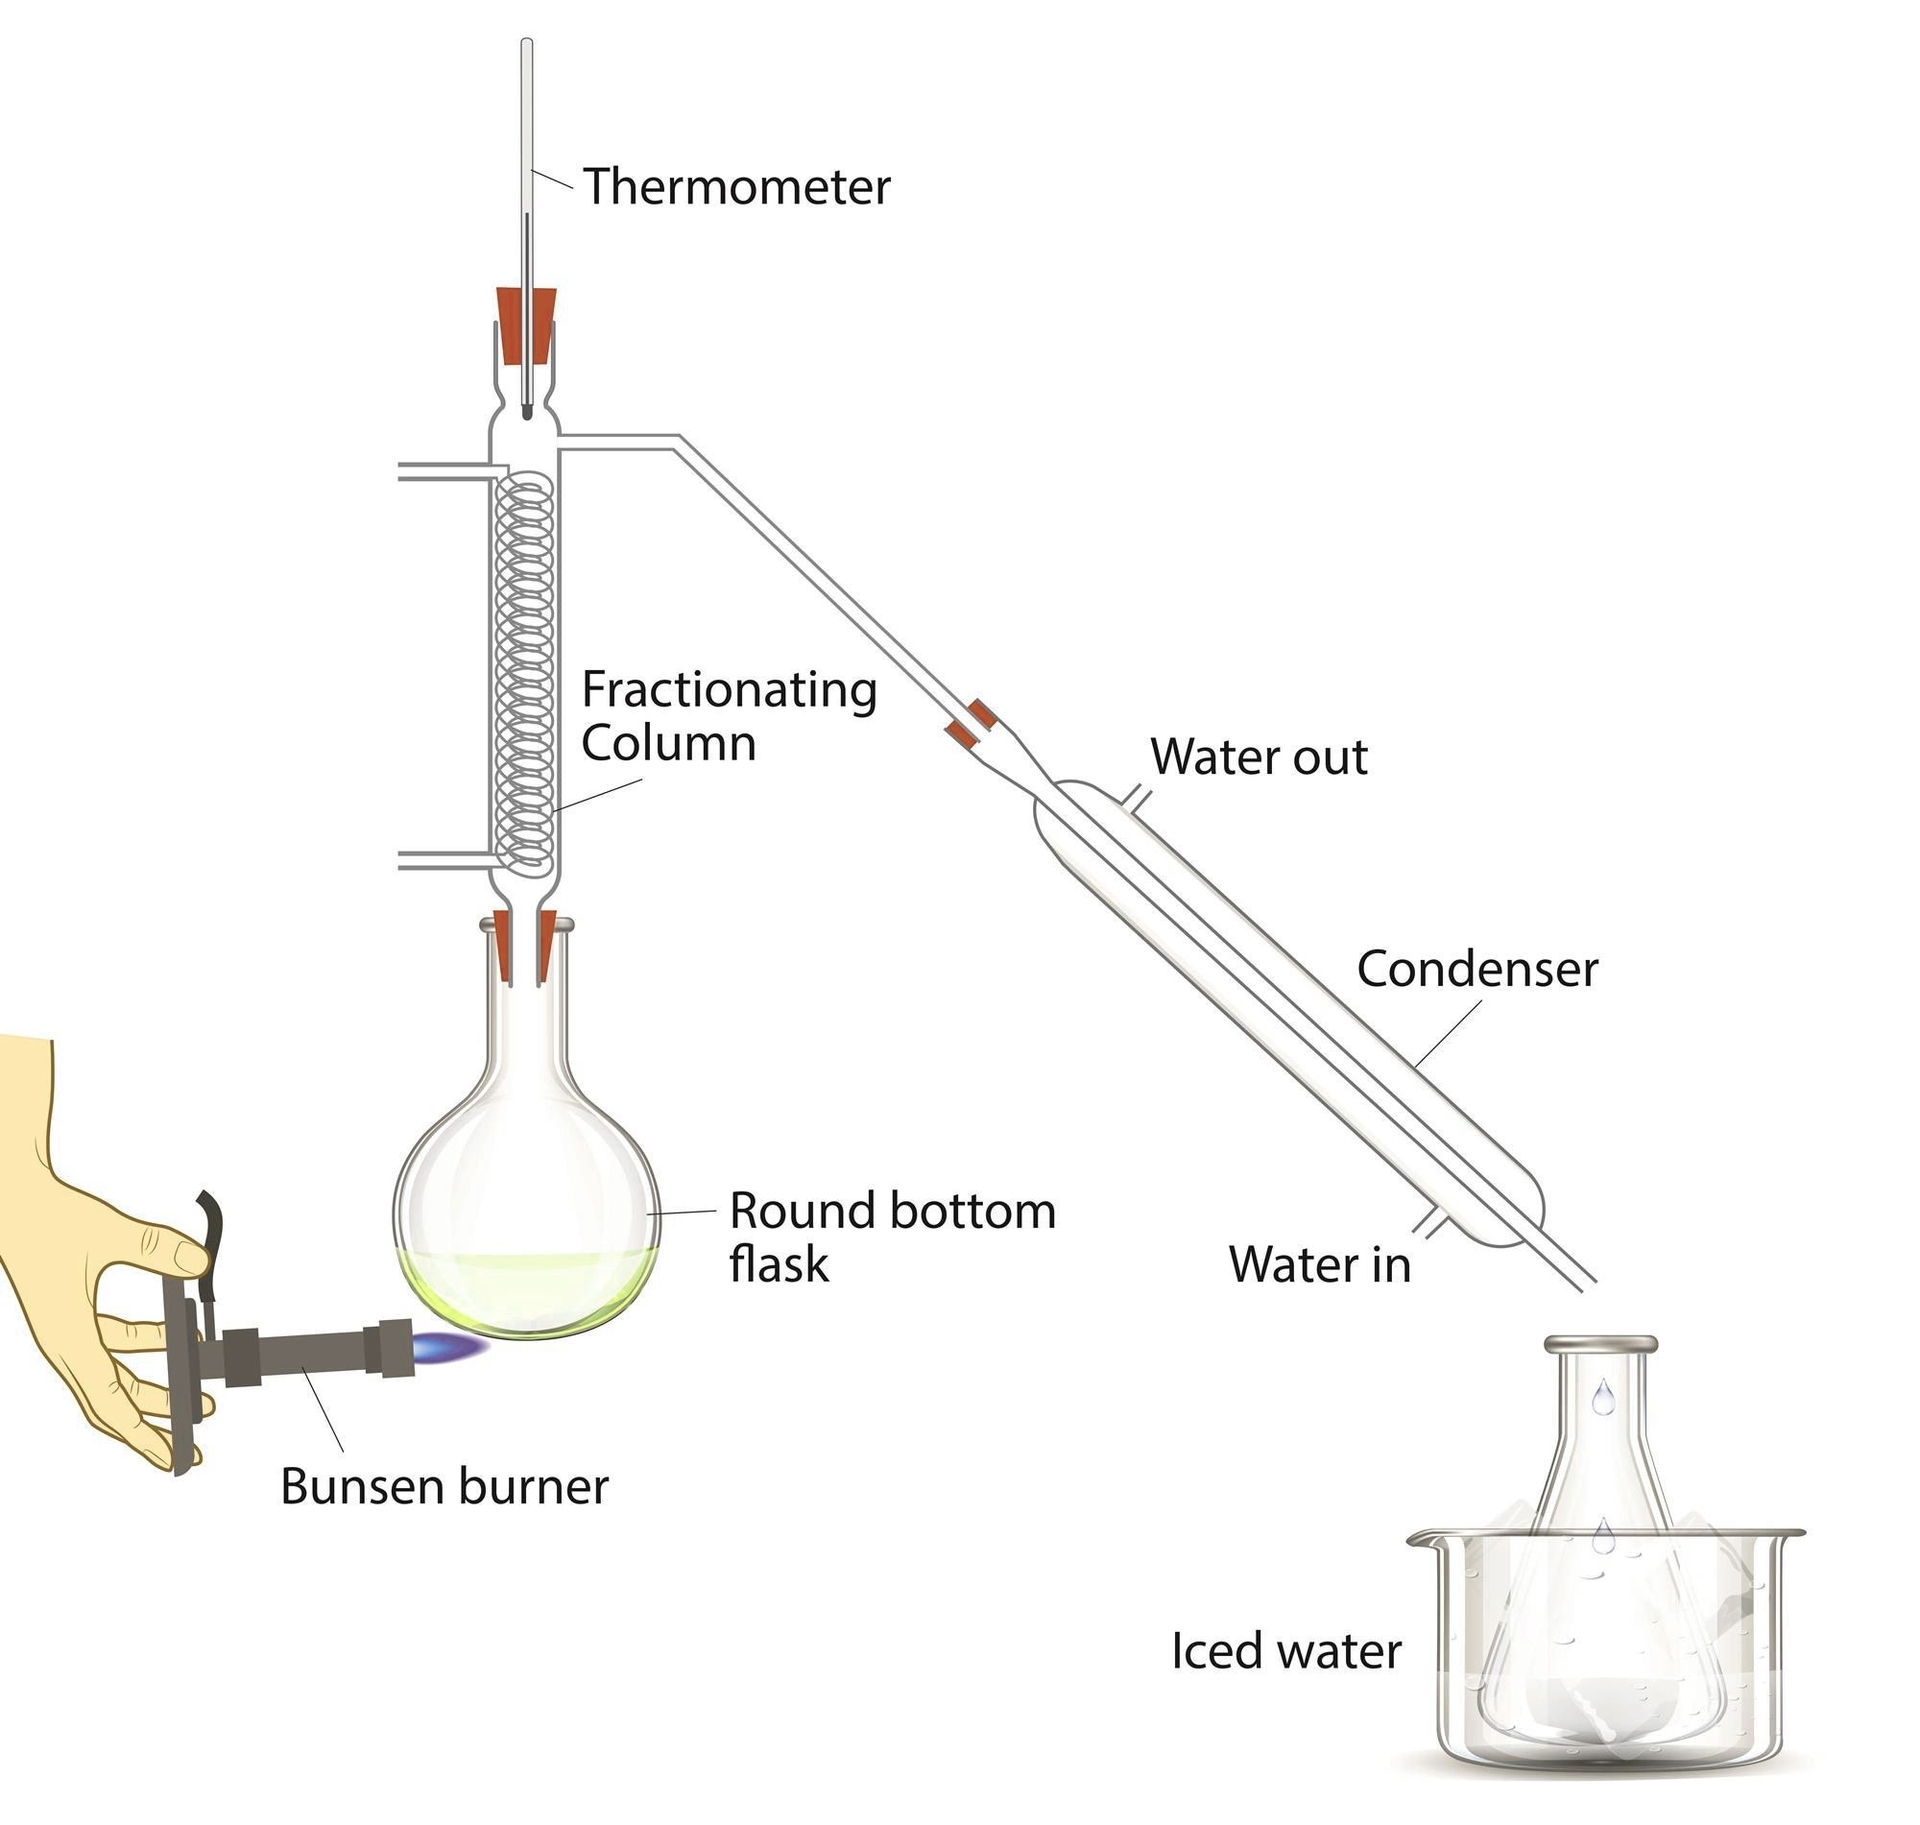
Animal Cell Anatomy Diagram

Animal Cell Anatomy Diagram: An animal cell anatomy diagram showcases the internal structures and organelles that make up the basic unit of animal life. It usually includes labeled parts such as the nucleus (the control center of the cell), nucleolus, mitochondria (the powerhouse of the cell), endoplasmic reticulum (smooth and rough), Golgi apparatus, lysosomes, ribosomes, and centrosomes. The cell membrane surrounds the cell, regulating what enters and leaves, while the cytoplasm serves as the medium for chemical reactions. This type of diagram is essential in biology education for visualizing and understanding cell function and structure.

Biological Diagrams

Uzbekistan Population

The above graph shows Uzbekistan Population. The country statistics are compiled by World Bank. Based on the latest demographics info provided for Uzbekistan.

Uzbekistan has a large and youthful population experiencing moderate growth. Fertility rates have declined but remain above replacement level, supported by improved healthcare and education. Urbanization is progressing rapidly, especially in cities like Tashkent, while rural areas maintain traditional family structures. The country’s economic diversification and regional migration trends influence demographic shifts and social development.

Uzbekistan Population

Biology Diagrams Examined

Biology Diagrams Examined: Biology diagrams are visual tools that illustrate complex biological processes and structures. They include representations of cellular components, metabolic pathways, and anatomical features, aiding in the understanding and communication of biological concepts.

Biology Diagrams Examined

El Salvador Population

The above graph shows El Salvador Population. World Bank is the source of this population data. Latest population information for El Salvador.

El Salvador’s population growth has slowed in recent years due to declining fertility and significant emigration. Urbanization and economic pressures have led to smaller families, with remittances from abroad playing a major role in the country’s economy and demographics.

El Salvador Population

Economic Growth Diagram

Economic growth is the increase in the production of goods and services in an economy over time. It is commonly measured in terms of the increase in aggregated market value of additional goods and services produced, using estimates such as Gross Domestic Product (GDP) . Economic growth is an important macroeconomic objective because it enables increased living standards, improved tax revenues, and helps to create new jobs .

Economic growth can be achieved through various means, including increases in capital goods, labor force, technology, and human capital . Capital goods refer to physical assets such as machinery, buildings, and infrastructure that are used to produce other goods and services. Labor force refers to the number of people who are employed or seeking employment. Technology refers to the knowledge, tools, and techniques used to produce goods and services. Human capital refers to the knowledge, skills, and abilities of the workforce .

Economic growth can be measured in nominal or real terms. Nominal economic growth is the increase in the production of goods and services in an economy without adjusting for inflation. Real economic growth is the increase in the production of goods and services in an economy after adjusting for inflation .

Economic growth can be divided into four phases: expansion, peak, contraction, and trough . During the expansion phase, employment, income, industrial production, and sales all increase, and there is a rising real GDP. The peak phase is when an economic expansion hits its ceiling. It is in effect a turning point. During the contraction phase, the elements of an expansion all begin to decrease. It becomes a recession when a significant decline in economic activity spreads across the economy. The trough phase is when an economic contraction hits its nadir .

Tax cuts are generally less effective in spurring economic growth than are increases in government spending . If the rewards of economic growth go only to an elite group, then it is unlikely that the growth will be sustainable .

In conclusion, economic growth is the increase in the production of goods and services in an economy over time. It can be achieved through various means, including increases in capital goods, labor force, technology, and human capital. Economic growth is commonly measured in terms of

Economic Growth Diagram

Iraq Births per woman

The above graph shows Iraq Births per woman. This is according to World Bank birth stats by country. Based on the latest available information for Iraq.

Iraq’s fertility rate remains relatively high, although it has gradually declined due to urbanization, conflict, and changing social norms. The country’s young population faces challenges in education, healthcare, and employment, while political instability and displacement impact demographic patterns. Efforts to improve reproductive health and family planning are ongoing amid rebuilding and development initiatives.

Iraq Births per woman

Suriname Population

This diagram presents Suriname Population. The country statistics are compiled by World Bank. Latest population information for Suriname.

Suriname has a small and diverse population that grows slowly, influenced by moderate fertility rates and migration patterns. The country’s population is concentrated primarily in urban areas along the coast, with interior regions sparsely populated. Economic activities such as mining and agriculture shape demographic distribution. Suriname’s multicultural society also reflects in its demographic characteristics and social dynamics.

Suriname Population

Least developed countries Population

The above graph shows Least developed countries Population. World Bank is the source of this population data. Based on the latest available information for Least developed countries.

Least developed countries generally have high fertility rates and very young populations, resulting in rapid population growth. These countries face significant challenges related to poverty, limited healthcare and education infrastructure, and political instability. High population growth pressures resources and services, complicating efforts to achieve economic development and social progress. Many least developed countries are focused on improving family planning access and enhancing basic services to manage demographic changes.

Least developed countries Population

Angola Births per woman

This diagram presents Angola Births per woman. World Bank is the source of this birth data. Based on the latest demographics info provided for Angola.

Angola has one of the highest fertility rates in the world, with large family sizes common across both rural and urban areas. Limited access to family planning and reproductive health services, along with cultural norms favoring large families, contribute to the country’s rapidly growing and youthful population.

Angola Births per woman

Australia Births per woman

Chart above demonstrates Australia Births per woman. World Bank is the source of this birth data. Based on the latest demographics info provided for Australia.

Australia has a relatively low fertility rate, with births per woman hovering below the replacement level of 2.1. This trend reflects a broader shift seen across many developed nations, where access to education, family planning, and career aspirations contribute to later childbearing and fewer children. Immigration plays a key role in sustaining population growth in Australia, offsetting the demographic impact of low fertility.

Australia Births per woman