U.s. Population Distribution By Age

The United States of America has a population of approximately 333.29 million people as of 2022. The largest age group in the US is adults aged 30 to 34, with around 11.84 million males and 11.47 million females in this category.

According to Statista, in 2022, about 17.96% of the US population fell into the 0-14 year category, 64.91% into the 15-64 age group, and 17.13% of the population were over 65 years of age.

The US population has been aging over the years, with the proportion of people aged 65 and above increasing. In 2021, the number of people aged 65 and above was 16.6% of the total population.

The US Census Bureau provides a detailed breakdown of the US population by age and sex. As of July 1, 2022, the resident population of the United States by sex and age was as follows :

| Age in years | Male | Female |
|—————-|———|———–|
| Under 5 | 9.48 | 9.06 |
| 5 to 9 | 10.23 | 9.78 |
| 10 to 14 | 10.7 | 10.19 |
| 15 to 19 | 11.08 | 10.55 |
| 20 to 24 | 11.6 | 11.1 |
| 25 to 29 | 11.35 | 10.84 |
| 30 to 34 | 11.84 | 11.47 |
| 35 to 39 | 11.3 | 10.97 |
| 40 to 44 | 10.82 | 10.61 |
| 45 to 49 | 9.84

U.s. Population Distribution By Age

Geography Teaching

Geoy Teaching is a term that refers to the use of geographic concepts, skills, and tools to enhance the teaching and learning of various subjects. Geoy Teaching can help students develop spatial thinking, critical thinking, problem-solving, and global awareness, as well as foster curiosity and appreciation for the natural and human world.
ome examples of Geoy Teaching are:

– Using maps, globes, atlases, and geographic information systems (GIS) to explore and analyze different places, regions, and phenomena.
– Incorporating fieldwork, citizen science, and outdoor learning activities to engage students with their local and global environment.
– Integrating geographic perspectives and themes, such as location, place, human-environment interaction, movement, and regions, into the curriculum of history, science, social studies, and other subjects.
– Applying geographic inquiry and skills, such as asking geographic questions, acquiring geographic information, organizing geographic information, analyzing geographic information, and answering geographic questions, to investigate and communicate about various issues and topics.
– Developing geographic literacy and competency, which is the ability to use geographic knowledge and skills to make informed decisions and take responsible actions in a complex and interconnected world.

Geoy Teaching is supported by various organizations and initiatives, such as Canadian Geographic Education, Governor’s Educator of the Year Program, and the National Geographic Society. These organizations provide resources, professional development, recognition, and funding for educators who want to implement Geoy Teaching in their classrooms.

Geoy Teaching is a valuable and innovative approach to education that can help students develop the knowledge, skills, and attitudes they need to succeed in the 21st century. Geoy Teaching can also foster a sense of wonder, curiosity, and respect for the diversity and beauty of our planet and its inhabitants.

Word count: 250

Geography Teaching

Crops For Carbon Farming

Carbon farming is a set of agricultural practices that aim to sequester carbon in the soil and vegetation, thereby reducing the amount of carbon dioxide in the atmosphere. The practice involves growing crops that absorb carbon from the air and store it in the soil. Carbon farming is an effective way to mitigate climate change, as it helps to reduce greenhouse gas emissions and improve soil health .

Regenerative farming is a type of carbon farming that focuses on improving soil health and sequestering carbon through unconventional techniques. These techniques include cover cropping, crop diversity, protecting watersheds, and integrating livestock into the farm system . Regenerative farming can help farmers reduce agricultural emissions while simultaneously improving soil health . The Canadian government has earmarked $270 million in its April 19 federal budget to support agriculture and climate-smart solutions, including regenerative farming .

Perennial crops are another type of crop that can be used for carbon farming. Perennial crops offer potential to sequester carbon when grown in multilayered systems. One system uses perennial staple crops that grow on trees that are analogs to maize and beans, or vines, palms and herbaceous perennials .

Here are some of the best crops for carbon sequestration :

1. Chestnuts: Chestnuts are a tree crop that can store high levels of carbon.
2. Walnuts: Walnuts are another crop that will store high levels of carbon.
3. Cobnuts: Cobnuts are a type of hazelnut that has been specifically bred for nut production.
4. Olives: Olives are a tree crop that can store carbon in the soil.
5. Apples: Apples are a tree crop that can store carbon in the soil.
6. Truffles: Truffles are a type of fungus that can store carbon in the soil.
7. Shiitake Mushrooms: Shiitake mushrooms are a type of fungus that can store carbon in the soil.
8. Perennial Vegetables: Perennial vegetables such as asparagus, rhubarb, and artichokes can store carbon in the soil.

In conclusion, carbon farming is an effective way to mitigate climate change, and regenerative farming and perennial crops are two types of carbon farming that can help to sequester carbon in the soil and vegetation. By adopting these practices, farmers can reduce agricultural emissions while simultaneously improving soil health ..

Crops For Carbon Farming

How To Draw Free Body Diagrams

A free-body diagram is a graphical representation of the forces acting on an object in a given situation. It can help us analyze the motion and equilibrium of the object, as well as the interactions with other bodies. Here is a brief guide on how to draw free-body diagrams in approximately 1000 words:

1. Sketch the situation. Draw a simple picture of the object and its surroundings, and identify the relevant forces that act on it. For example, if the object is a car on a slope, you might draw the car, the slope, the ground, and the forces of gravity, normal, friction, and tension (if there is a rope attached to the car).
2. Isolate the object. Draw a dot or a box to represent the object, and erase everything else. This is the free-body diagram of the object, and it shows only the forces that act directly on it. Do not include forces that act on other bodies, or forces that the object exerts on other bodies. For example, if the object is a car on a slope, you would erase the slope, the ground, and the rope, and only keep the dot or the box for the car.
3. Draw and label the forces. Draw arrows from the dot or the box to show the direction and magnitude of each force. The length of the arrow should be proportional to the strength of the force. Label each arrow with the type and symbol of the force, such as F_g for gravity, F_N for normal, F_f for friction, and F_T for tension. Use subscripts to indicate which bodies are involved in the force, such as F_N,car for

How To Draw Free Body Diagrams

Composition Of The World Economy By Gdp (Ppp)

The composition of the world economy by GDP (PPP) is a way of measuring the relative size and productivity of different countries or regions based on their gross domestic product (GDP) adjusted for purchasing power parity (PPP). GDP is the total value of goods and services produced within a country or region in a given period of time. PPP is a method of comparing the prices and costs of living across different countries or regions, taking into account the differences in exchange rates, inflation, and quality of goods and services. By using GDP (PPP), we can compare the economic output and living standards of different countries or regions more accurately than using nominal GDP, which is based on current market exchange rates.

According to the International Monetary Fund (IMF), the world economy in 2023 is projected to be worth about $136.5 trillion in current international dollars, based on GDP (PPP) estimates. The top 10 economies by GDP (PPP) in 2023 are expected to be:

– China: $25.4 trillion (18.6% of world total)
– United States: $20.5 trillion (15.0% of world total)
– India: $10.5 trillion (7.7% of world total)
– Japan: $5.5 trillion (4.0% of world total)
– Germany: $4.5 trillion (3.3% of world total)
– Russia: $4.0 trillion (2.9% of world total)
– Indonesia: $3.5 trillion (2.6% of world total)
– Brazil: $3.4 trillion (2.5% of world total)
– United Kingdom: $3.1 trillion (2.3% of world total)
– France: $3.1 trillion (2.3% of world total)

These 10 economies account for about 61% of the world’s GDP (PPP) in 2023. The remaining 39% is shared by 186 other economies, ranging from $1.9 trillion (Spain) to $0.01 trillion (Tuvalu). The average GDP (PPP) per capita in the world in 2023 is estimated to be about $17,500, but there is a wide variation among countries and regions, from $131,000 (Qatar) to $800 (Burundi).

The composition of the world economy by GDP (PPP) reflects the economic power and potential of different countries and regions, as well as their challenges and opportunities. It also shows the diversity and complexity of the global economic system, which is influenced by many factors such as population, geography, natural resources, technology, trade, politics, culture, and history. By using GDP (PPP), we can better understand the similarities and differences among countries and regions, and how they interact and cooperate in the global market..

Composition Of The World Economy By Gdp (Ppp)

Force Diagram Physics

Force is a fundamental concept in physics that describes the interaction between two objects. It is defined as a push or pull on an object that can cause it to accelerate, change direction, or deform . The SI unit of force is the newton (N), which is defined as the amount of force required to accelerate a mass of one kilogram at a rate of one meter per second squared .

There are several types of forces that can act on an object, including gravitational, electromagnetic, normal, frictional, and tension forces . Gravitational force is the force that attracts two objects with mass towards each other . Electromagnetic force is the force that arises between electrically charged particles and is responsible for the behavior of electric and magnetic fields . Normal force is the force that acts perpendicular to the surface of an object and prevents it from falling through the surface . Frictional force is the force that opposes the motion of an object when it is in contact with another object . Tension force is the force that is transmitted through a string, rope, or wire when it is pulled tight by forces acting from opposite ends .

The concept of force is central to classical mechanics and is described by Newton’s three laws of motion . The first law states that an object at rest will remain at rest, and an object in motion will remain in motion with a constant velocity unless acted upon by an external force . The second law states that the acceleration of an object is directly proportional to the force applied to it and inversely proportional to its mass . The third law states that for every action, there is an equal and opposite reaction .

In addition to classical mechanics, the concept of force is also important in other areas of physics, such as electromagnetism, thermodynamics, and quantum mechanics . For example, in electromagnetism, the force between two charged particles is described by Coulomb’s law . In thermodynamics, the force that drives heat transfer is described by the temperature gradient . In quantum mechanics, the force between two particles is described by the exchange of virtual particles .

Force Diagram Physics

Ocean Earth Layers

The ocean is a vast body of water that covers more than 70% of the Earth’s surface. It is divided into several layers based on the depth and temperature of the water. The topmost layer is called the epipelagic zone or the sunlight zone. It extends from the surface to a depth of 200 meters (660 feet) . This layer is characterized by abundant sunlight, which supports photosynthesis and the growth of phytoplankton. The temperature in this zone varies widely, ranging from 28°F (-2°C) near the North Pole to as high as 97°F (36°C) in the Persian Gulf . The next layer is the mesopelagic zone, also known as the twilight zone. It extends from 200 meters (660 feet) to 1,000 meters (3,300 feet) . This layer is characterized by a rapid decrease in temperature with increasing depth, forming a transition layer between the mixed layer at the surface and deeper water. The thermocline, a region where water temperature decreases rapidly with increasing depth, is located in this zone . The mesopelagic zone is also known for its bioluminescent organisms, which produce light to attract prey or communicate with each other in the dark environment .

The bathypelagic zone is the layer below the mesopelagic zone and extends from 1,000 meters (3,300 feet) to 4,000 meters (13,100 feet) . This layer is characterized by a constant temperature of 39°F (4°C) and complete darkness, except for the bioluminescence of the animals themselves . The pressure in this zone is extreme, reaching over 5850 pounds per square inch at depths of 4,000 meters (13,100 feet) . Despite the harsh conditions, some animals, such as sperm whales, can dive down to this level in search of food.

The abyssopelagic zone or the abyssal zone is the layer below the bathypelagic zone and extends from 4,000 meters (13,100 feet) to 6,000 meters (19,700 feet) . It is the pitch-black bottom layer of the ocean, where the water temperature is constantly near freezing . Only a few creatures can be found at these crushing depths, and the area of the deep-ocean floor lying in this zone accounts for three-quarters of the total area .

The deepest zone of the ocean is the hadalpelagic zone, which extends from 6,000 meters (19,700 feet) to the very bottom of the ocean . The deepest part of the ocean is the Mariana Trench off the coast of Japan, which has a depth of 10,994 meters (36,070 feet) . The temperature in this zone is just above freezing, and the pressure is immense, reaching over 15,000 pounds per square inch . Only a few organisms, such as amphipods and bacteria, can survive in this zone .

In summary, the ocean is divided into several layers based on the depth and temperature of the water. The topmost layer is the epipelagic zone, followed by the mesopelagic zone, the bathypelagic zone, the abyssopelagic zone, and the hadalpelagic zone. Each layer has unique characteristics and supports different types of organisms. The ocean is a fascinating and mysterious place, and there is still much to learn about its many layers and inhabitants.

: [National

Ocean Earth Layers

Plant And Animal Cell Diagrams

Plant and animal cells are both eukaryotic cells, meaning they have a defined nucleus and complex structures encased within membranes (organelles). However, plant and animal cells also have some key differences in terms of their size, shape, and the cell structures they contain. Here is a brief overview of some of the main differences between plant and animal cells:

– Size: Animal cells are generally smaller than plant cells. Animal cells range from 10 to 30 micrometers in length, while plant cells range from 10 and 100 micrometers in length.
– Shape: Animal cells come in various sizes and tend to have round or irregular shapes. Plant cells are more similar in size and are typically rectangular or cube shaped[^

Plant And Animal Cell Diagrams

Us Population By Race

The United States is a diverse country with a population of over 332 million people. According to the U.S. Census Bureau, the country’s population is becoming increasingly diverse. The 2020 Census used two separate questions to collect the races and ethnicities of the U.S. population, following the standards set by the U.S. Office of Management and Budget (OMB) in 1997. The following table shows the racial and ethnic composition of the U.S. population as of 2019:

| Race/Ethnicity | Percentage of Population |
|—————–|————————–|
| White | 60.1% |
| Hispanic | 18.5% |
| Black | 12.2% |
| Asian | 5.6% |
| Multiple Races | 2.8% |
| American Indian/Alaska Native | 0.7% |
| Native Hawaiian/Other Pacific Islander | 0.2% |

It is important to note that the above percentages are based on self-identification and may not be an accurate representation of the actual population. The overall racial and ethnic diversity of the country has increased since 2010, according to U.S. Census Bureau analyses. The concept of “diversity” refers to the representation and relative size of different racial and ethnic groups within a population and is maximized when all groups are represented in an area and have equal shares of the population.

Us Population By Race

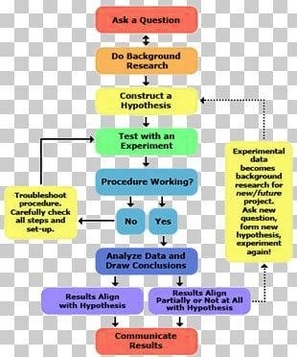
Organic Production Flowchart

Organic production flow is a holistic system designed to optimize the productivity and fitness of diverse communities within the agro-ecosystem, including soil organisms, plants, livestock and people . The principal goal of organic production is to develop enterprises that are sustainable and harmonious with the environment . Organic farming promotes the use of crop rotations and cover crops and encourages balanced host/predator relationships. Organic residues and nutrients produced on the farm are recycled back to the soil. Cover crops and composted manure are used to maintain soil organic matter and fertility .

The general principles of organic production, from the Canadian Organic Standards (2020) , include the following:
– Protect the environment, minimize soil degradation and erosion, decrease pollution, optimize biological productivity and promote a sound state of health.
– Maintain long-term soil fertility by optimizing conditions for biological activity within the soil.
– Maintain biological diversity within the system.
– Recycle materials and resources to the greatest extent possible within the operation.

Organic production in Ontario includes both certified and uncertified production . The main reasons farmers state for wanting to farm organically are their concerns for the environment and about working with agricultural chemicals in conventional farming systems. Organic farmers find their method of farming can be profitable and personally rewarding .

Organic production is a system that integrates cultural, biological, and mechanical practices that foster cycling of resources, promote ecological balance, and conserve biodiversity . The system is designed to optimize the productivity and fitness of diverse communities within the agro-ecosystem, including soil organisms, plants, livestock, and people . Organic production systems are based on the principles of health, ecology, fairness, and care . Organic production systems aim to produce food using natural substances and processes, and to respect the balance of ecosystems .

Organic certification is a process that verifies that agricultural products have been produced and handled according to strict guidelines. The certification process is designed to ensure that organic products meet the standards set by the Canadian Organic Standards (2020) . The process of organic certification for farmers involves a flow chart that outlines the steps involved in the certification process. Costs are calculated either by acreage or by anticipated gross sales .

In summary, organic production flow is

Organic Production Flowchart