Simple Machines for Kids: A Fun and Easy Guide
Have you ever wondered how we can lift heavy things, move objects, or make work easier? The answer is simple machines! These are basic tools that help us do work with less effort. Even though they are called “simple,” they are very powerful and are used in everyday life all around the world, all around us.
Let’s explore the six main types of simple machines in a way that’s hopefully easy and fun to understand.
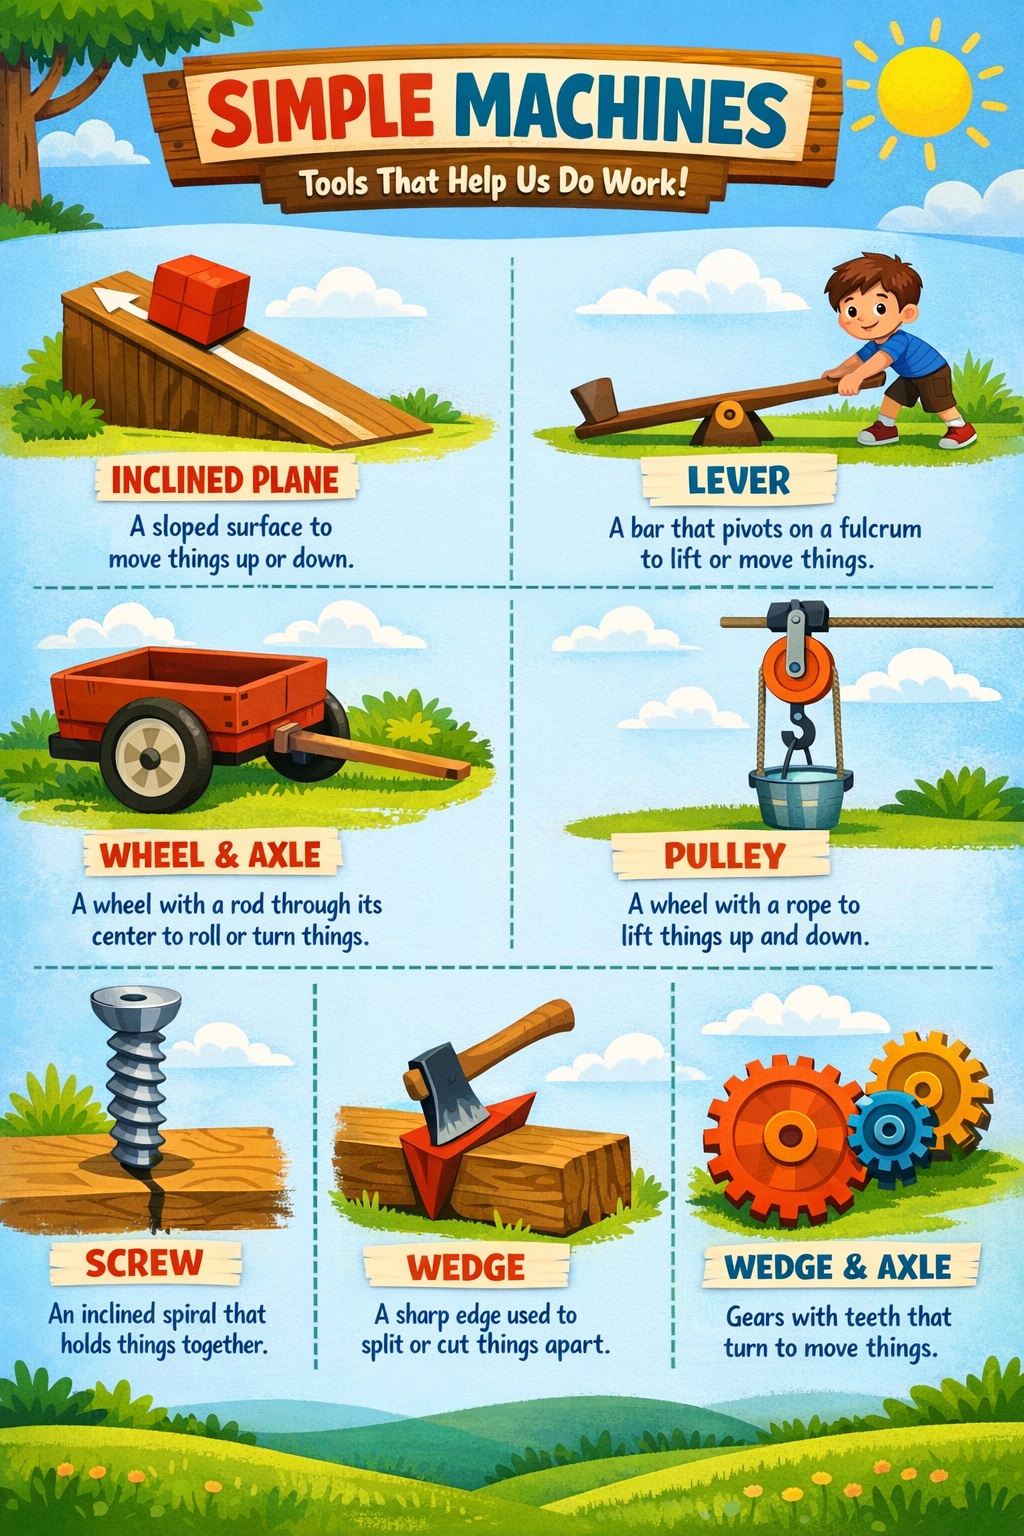
Inclined Plane
An inclined plane is just a slanted surface, like a ramp. Instead of lifting something straight up (which can be hard), you can push it up a slope more easily. For example, when you roll a box up a ramp into a truck, you’re using an inclined plane. It helps reduce the amount of force needed.
Lever
A lever is a long bar that moves around a fixed point called a fulcrum. When you push down on one end, the other end lifts up. Think of a seesaw at the playground—that’s a perfect example of a lever! Levers help us lift heavy objects with less effort.
Wheel and Axle
A wheel and axle work together to help things move or turn. The wheel is the round part, and the axle is the rod through its center. When one turns, the other does too. Bikes, carts, and cars all use wheels and axles to move smoothly and easily.
Pulley
A pulley is a wheel with a rope or string wrapped around it. It helps lift things up or lower them down. You might see a pulley on a flagpole or a construction site. By pulling down on the rope, you can lift something heavy up high!
Screw
A screw is like an inclined plane wrapped around a cylinder. It has a spiral shape that helps hold things together or lift materials. When you turn a screw, it moves deeper into a surface, making it great for building and fixing things.
Wedge
A wedge is a tool with a sharp edge that helps split or cut objects. Axes and knives are examples of wedges. When force is applied, the wedge pushes materials apart, making cutting or splitting much easier.
Why Simple Machines Matter
Simple machines are everywhere! From opening a door to riding a bike, they make our lives easier every day. By understanding how they work, kids can start to see the science behind everyday tools and even invent their own!
If you look around, you’ll start spotting simple machines all over the place. Learning about them is a great first step into the exciting world of science and engineering!