Skip to content
cropped logo

Ygraph

Charts, Graphs and Diagrams

Menu

Primary menu

  • Submit Diagram
  • Science
  • Business
  • Economy
    • GDP
  • Demographics
  • Explained
    • Signs
    • Maps
  • Health
  • Anatomy
  • Sizes

Tag Archives: scientific method visual

Creating and Testing Hypothesis

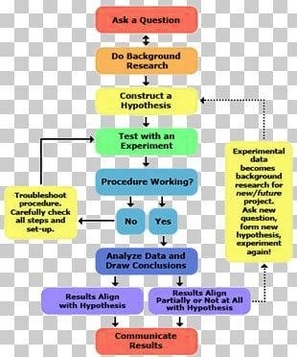
Creating and Testing Hypothesis: Creating and testing a hypothesis involves formulating a testable statement based on observations, conducting experiments or studies to gather data, and analyzing the results to determine whether the hypothesis is supported or refuted.

Creating and Testing Hypothesis
Posted in chart | Tagged experiment flowchart, hypothesis diagram, research process explained, scientific method visual, testing theory chart

Scientific Example Of

Scientific Example Of: A scientific example of the application of physics is the use of X-rays in medical imaging. X-rays, a form of electromagnetic radiation, penetrate the body to create images of bones and tissues, aiding in diagnosis and treatment.

Scientific Example Of
Posted in chart | Tagged example of theory and practice, science applications explained, science in real life, scientific example diagram, scientific method visual

Primary Sidebar Widget Area

Top Diagrams

Latest Posts

  • Benin Population
  • Science Diagrams That Look Like Memes Example Of
  • Simple Machines for Kids: Easy Guide to Levers, Pulleys, and More
  • Probability Tree Diagrams
  • World Population By Ethnicity Pie Chart
  • Greenhouse Gas Emissions From Farming
  • Middle East & North Africa Births per woman
  • Sri Lanka Births per woman
  • Euro area Births per woman
  • Basic Body Diagram
  • Nicaragua Births per woman
  • Lithuania Population
  • Life Sciences Caps Diagrams Grade 12
  • Diagram Science
  • Real Number Set Diagram

Top Tags

  • sizes (35)
  • size chart (35)
  • size conversion (35)
  • economy chart (33)
  • economy graph (33)
  • economy diagram (33)
  • cell (29)
  • cell diagram (29)
  • cell illustration (29)
  • window (24)
  • window diagram (24)
  • types of windows (24)
  • origami (16)
  • origami steps (16)
  • how to make origami (16)
  • biology (16)
  • biology diagram (16)
  • yoga (8)
  • yoga routine (8)
  • yoga poses (8)

Categories

  • anatomy
  • Business
  • chart
  • Demographics
  • Eco
  • Ecom
  • Economy
  • Explained
  • GDP
  • Health
  • Maps
  • notice
  • science
  • Signs
  • Sizes
  • Uncategorized

Useful Resources

  • Chart Diagram
  • Meme Gif
  • Logo Sign
  • Human Anatomy
  • Graph Diagram
  • Economy GDP
  • Twitter
Copyright © 2026 Ygraph. All Rights Reserved.
Theme: Catch Box by Catch Themes
Scroll Up
WP Twitter Auto Publish Powered By : XYZScripts.com