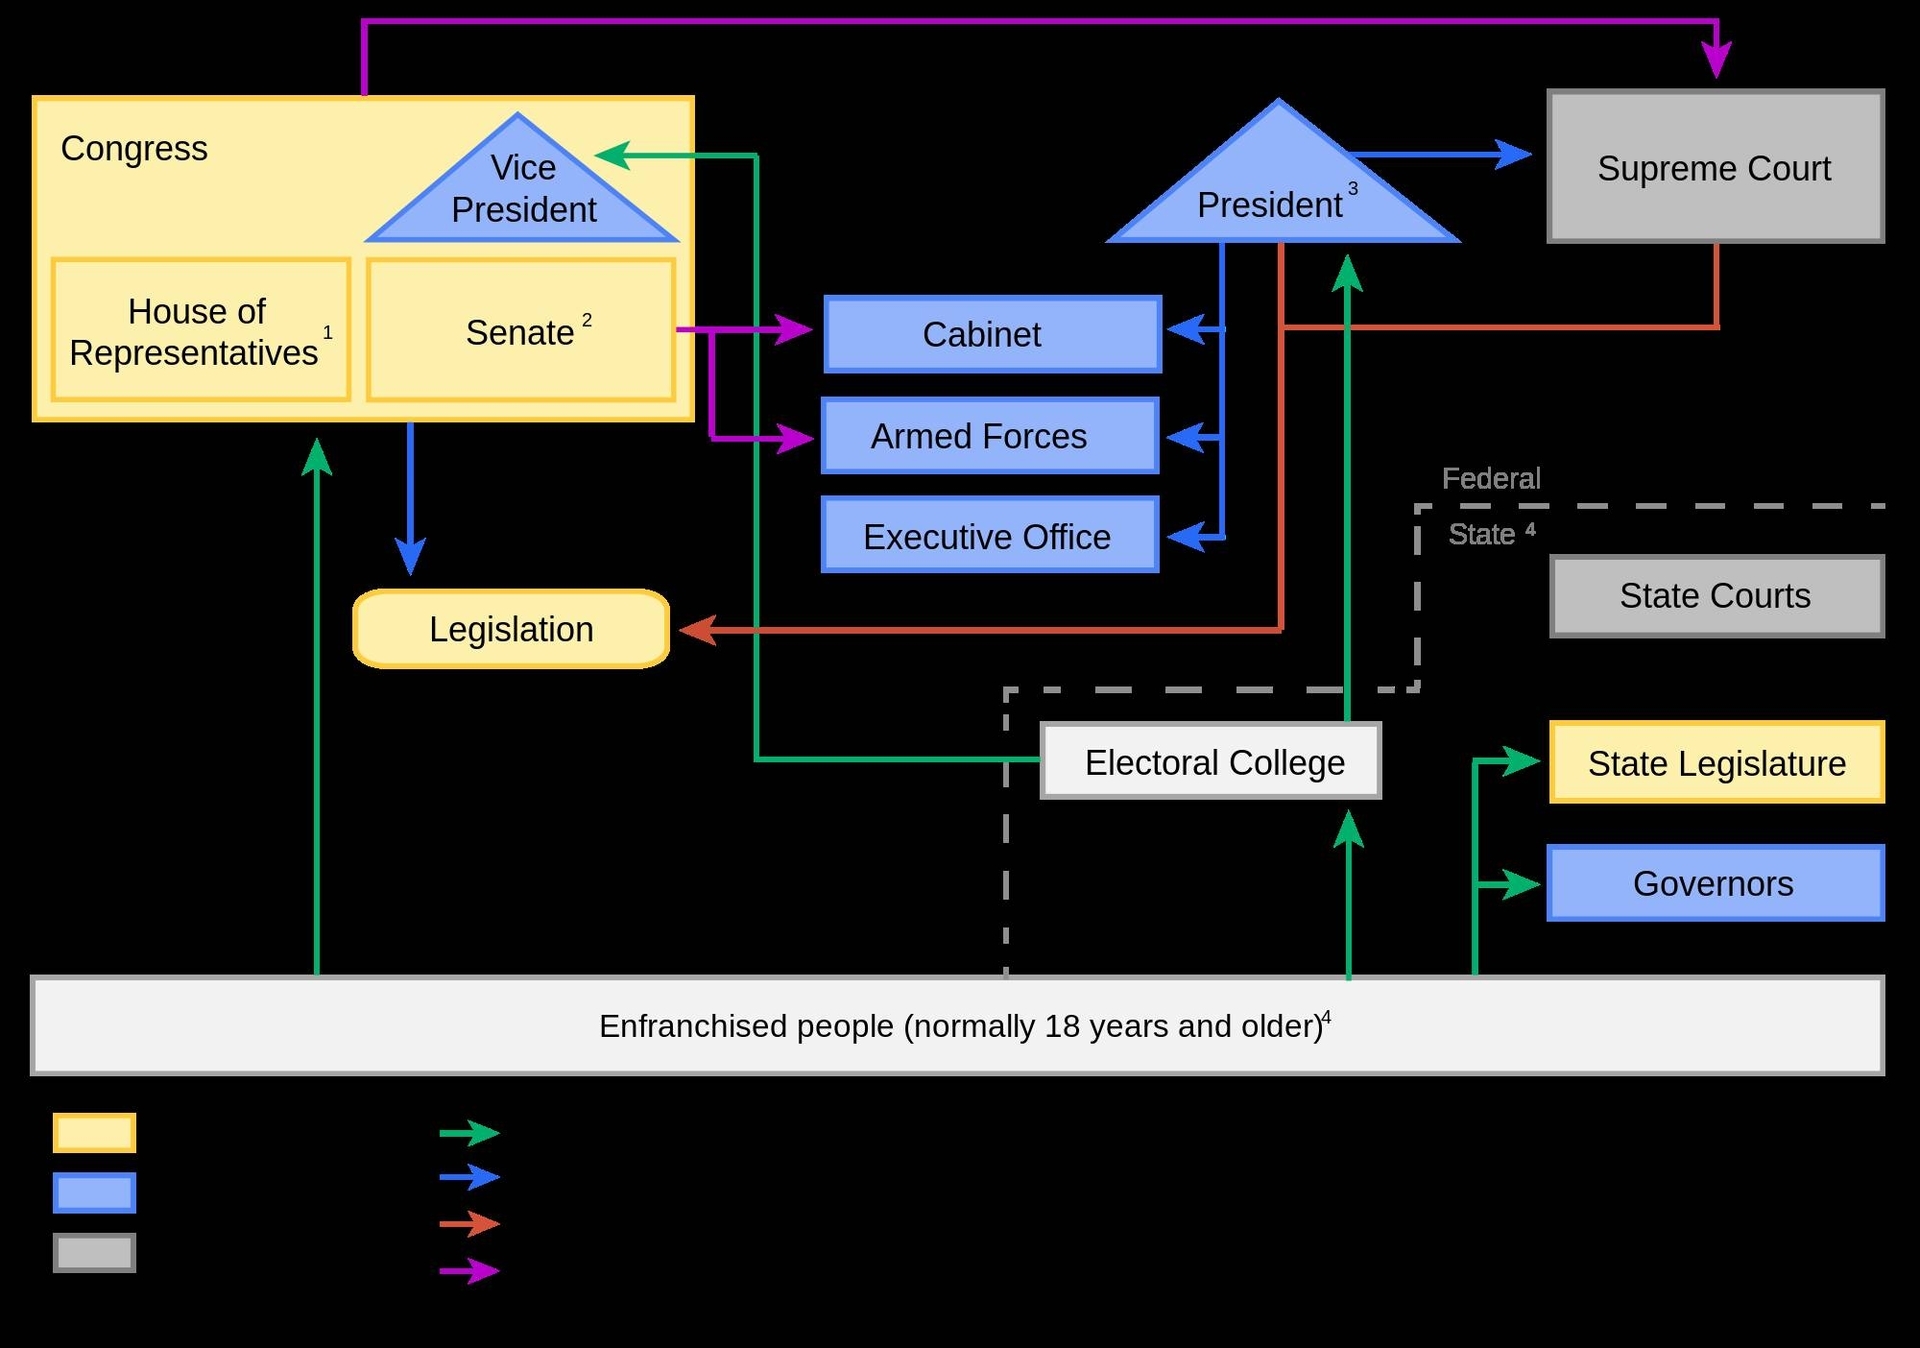
Political System Of The United States: The political system of the United States is a federal republic with a presidential system. It consists of three branches
Charts, Graphs and Diagrams
Political System Of The United States: The political system of the United States is a federal republic with a presidential system. It consists of three branches
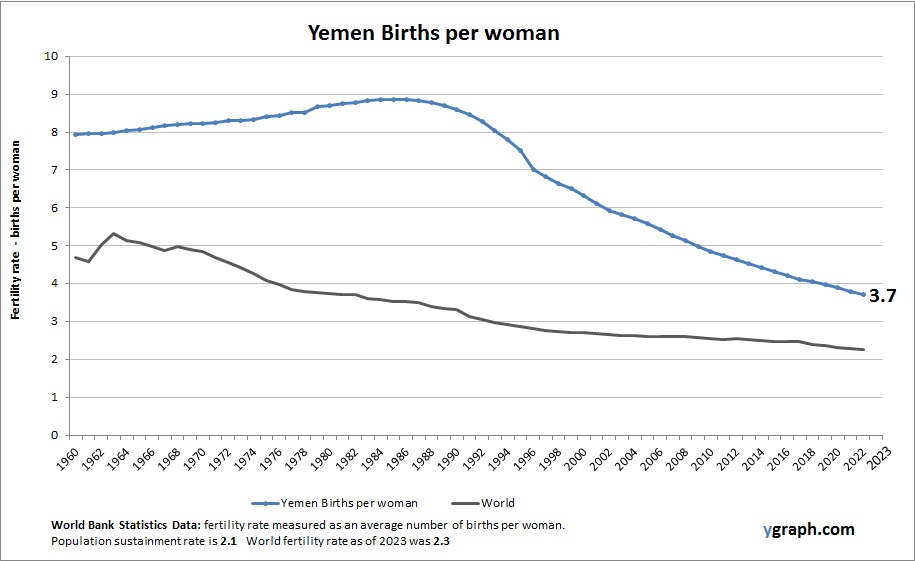
This diagram presents Yemen Births per woman. World Bank is the source of this birth data. Based on the latest available information for Yemen.
Yemen has very high fertility rates, among the highest globally, fueled by cultural norms and limited access to family planning amid political instability and humanitarian crises. This rapid population growth presents significant challenges to resource management and social services.
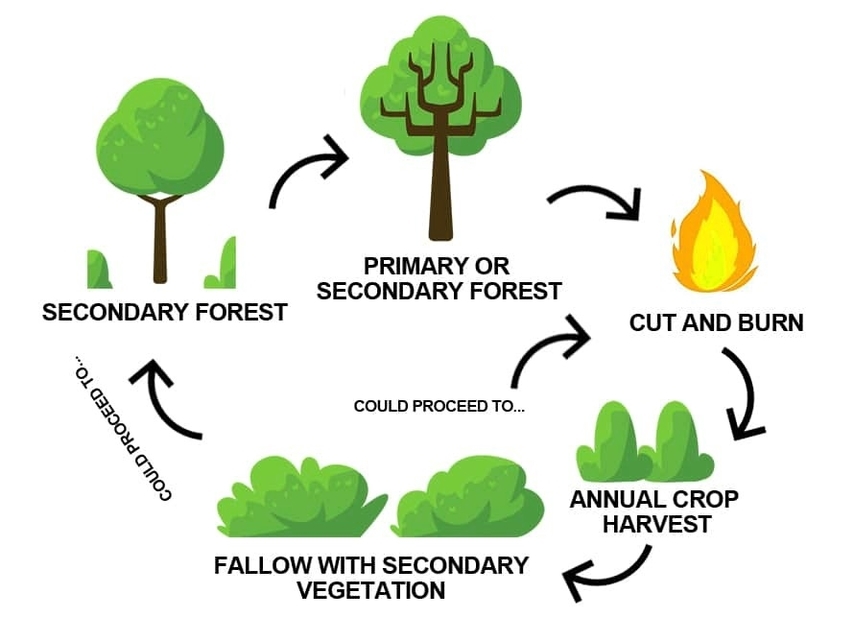
Shifting cultivation is a form of agriculture that involves moving from one plot of land to another after a few years of cropping. It is practiced mainly in tropical and subtropical regions, where soil fertility is low and rainfall is unpredictable. Shifting cultivation has both advantages and disadvantages for the environment and the people who practice it. Here is an essay of about 1000 words on shifting cultivation:
hifting cultivation, also known as slash-and-burn agriculture, is a farming system that has been used for thousands of years by indigenous people in many parts of the world. It is based on the principle of rotating crops and fallows, or periods of rest for the land, to maintain soil fertility and prevent pest and disease outbreaks. Shifting cultivation is usually practiced in areas where the natural vegetation is forest or woodland, and where the population density is low.
The process of shifting cultivation involves clearing a patch of land by cutting down the trees and shrubs, and burning them to create ash that enriches the soil. The cleared land, called a swidden, is then planted with crops such as rice, maize, cassava, yams, and vegetables. The crops are harvested for two or three years, until the soil becomes exhausted or the weeds become too difficult to control. The farmers then abandon the swidden and move to a new location, where they repeat the cycle. The old swidden is left to regenerate naturally, and may be reused after a period of time, usually 10 to 20 years, depending on the local conditions.
hifting cultivation has several benefits for the environment and the people who practice it. First, it is a low-input and low-cost system that does not require external inputs such as fertilizers, pesticides, or irrigation. It relies on the natural processes of nutrient cycling and biological diversity to sustain crop production. Second, it is a flexible and adaptive system that can cope with the variability and uncertainty of the climate and the soil. It allows the farmers to adjust the size, location, and duration of their swiddens according to the availability of land and water, and the demand for food. Third, it is a system that preserves and enhances the biodiversity of the ecosystem. By creating a mosaic of different stages of forest succession, shifting cultivation maintains a high diversity of plant and animal species, and provides habitats and resources for wildlife. Fourth, it is a system that respects and reflects the culture and knowledge of the local people. It is based on the traditional ecological knowledge and practices of the farmers, who have a deep understanding of the local environment and its dynamics. It also supports the social and economic well-being of the farmers, who have access to a variety of food and non-food products from their swiddens and fallows,
This diagram presents Nigeria Births per woman. This is according to World Bank birth stats by country. Latest births per woman information for Nigeria.
Nigeria’s fertility rate remains high compared to global averages, particularly in rural regions. The country’s large and youthful population continues to grow rapidly, shaped by diverse ethnic and cultural groups. Efforts to improve education and healthcare access aim to moderate birth rates over time.
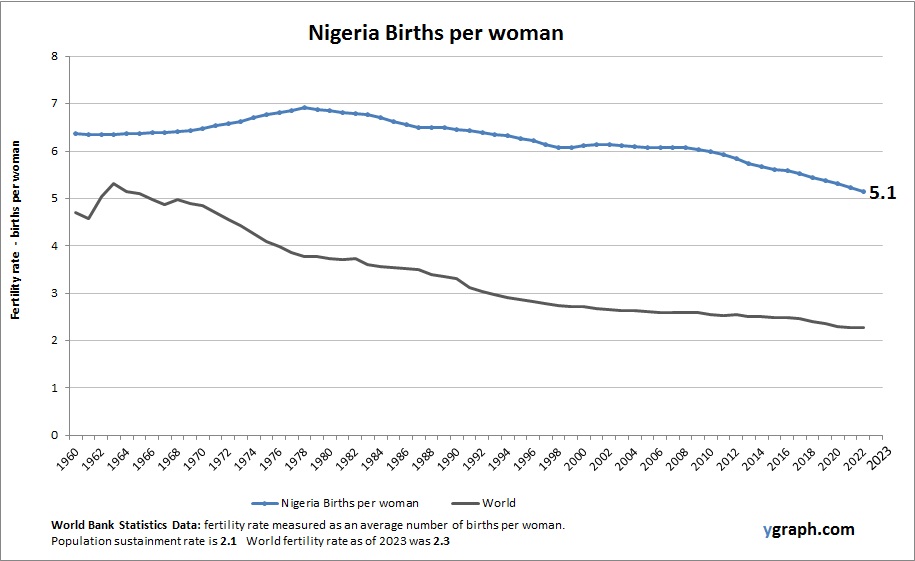

Chart above demonstrates Puerto Rico Population. This is according to World Bank total population stats. Based on the latest demographics info provided for Puerto Rico.
Puerto Ricos population has been shrinking, primarily due to emigration to the U.S. mainland and low birth rates. Economic challenges and natural disasters have accelerated this trend, with significant implications for the island’s workforce and public services.

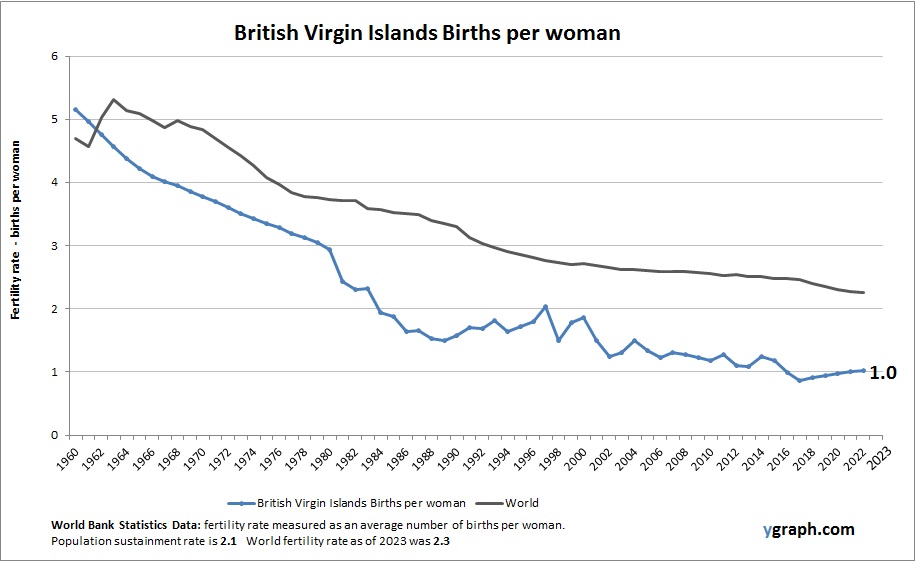
The above graph shows British Virgin Islands Births per woman. The fertility rate statistics are compiled by World Bank. Based on the latest available information for British Virgin Islands.
The British Virgin Islands has a low fertility rate, reflective of its developed healthcare system and high living standards. Smaller family sizes are common, and migration plays a significant role in shaping the territorys demographic structure, especially as more young professionals move for work opportunities.
The above graph shows Morocco Population. World Bank is the source of this population data. Based on the latest available information for Morocco.
Moroccos population growth has slowed due to declining fertility rates and increasing urbanization. Improvements in education and healthcare have supported demographic transition. The countrys young population presents opportunities for economic growth, though unemployment and rural-urban disparities remain challenges.
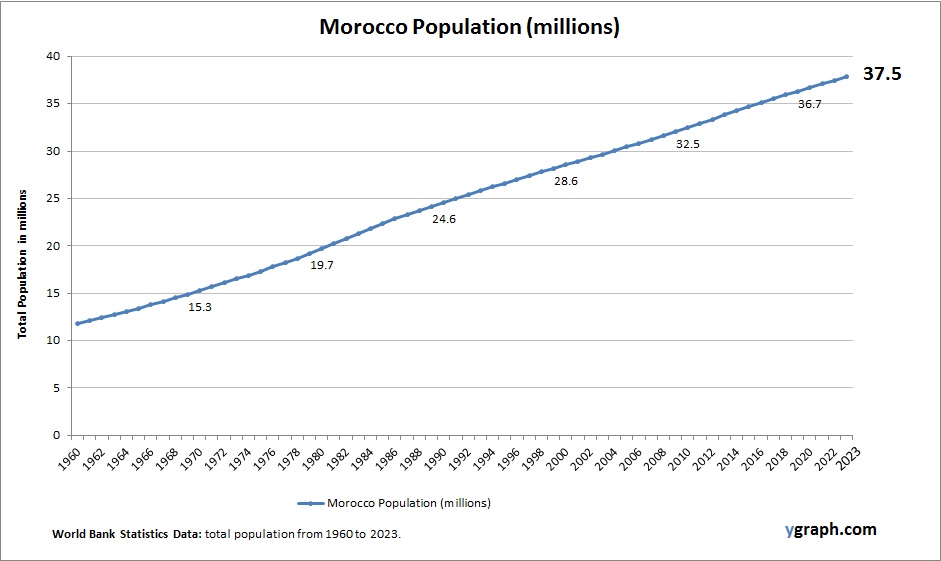
Chart above demonstrates Maldives Births per woman. World Bank is the source of this birth data. Based on the latest demographics info provided for Maldives.
The Maldives exhibits moderate fertility rates, reflecting the influence of education, healthcare access, and urbanization on family size preferences. Population growth is steady, with tourism and economic development shaping demographic trends.
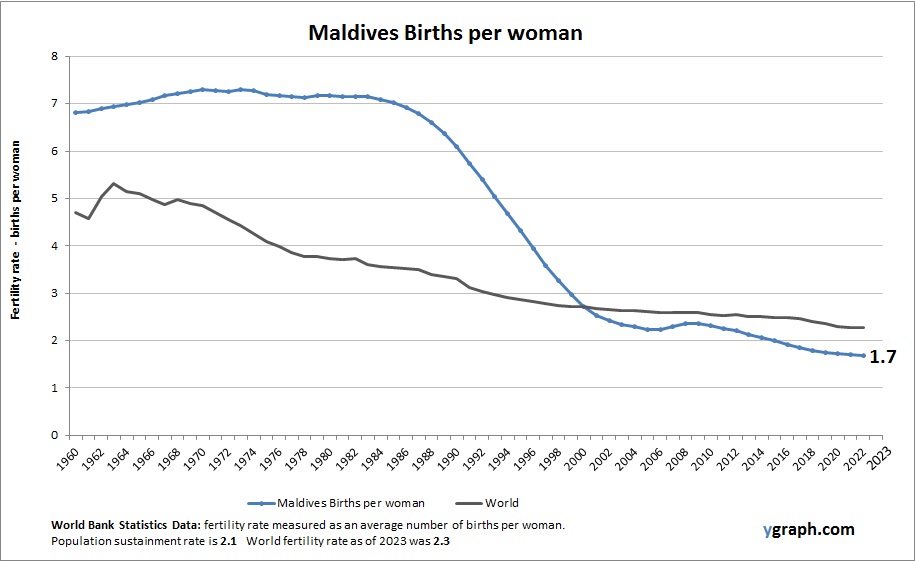
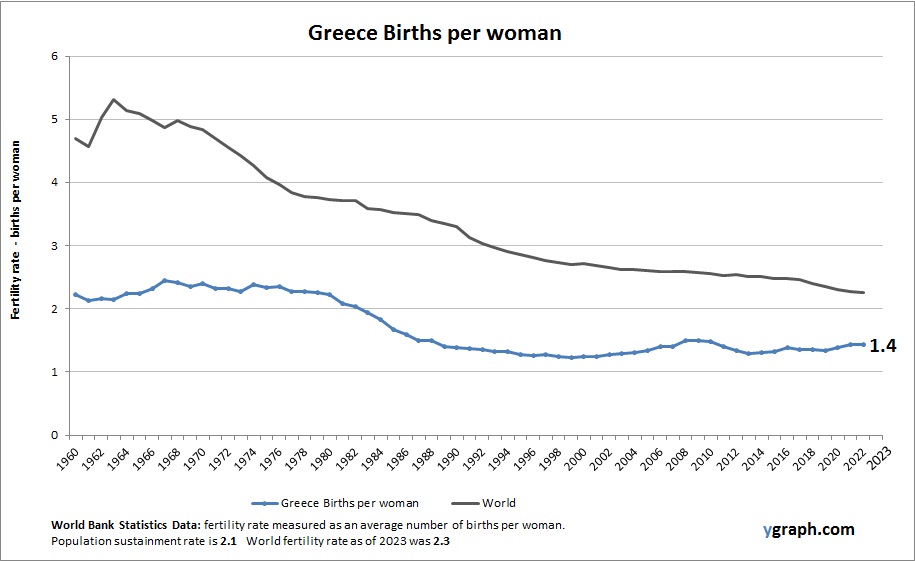
Chart above demonstrates Greece Births per woman. The fertility rate statistics are compiled by World Bank. Latest births per woman information for Greece.
Greece has one of the lowest fertility rates in Europe, contributing to a shrinking and aging population. Economic instability and delayed family formation are key factors, and demographic decline is a growing concern for long-term social and economic planning.