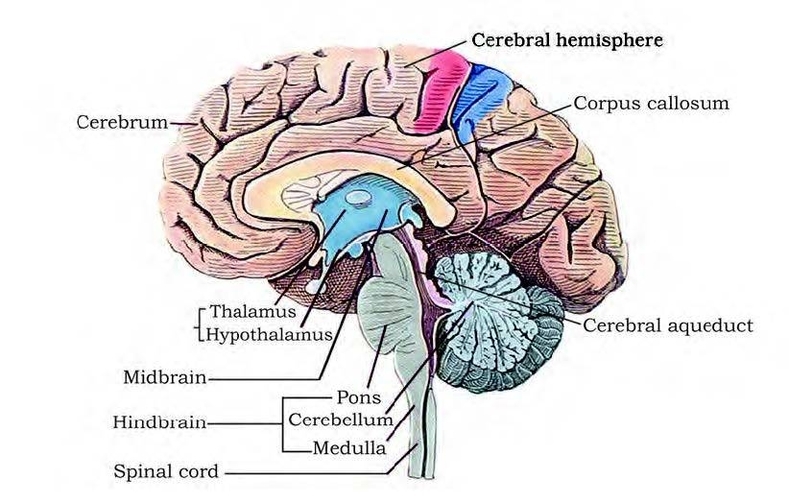
Greenhouse Gas Emissions From Farming

Greenhouse gas emissions from farming are the result of various agricultural activities that release carbon dioxide (CO2), methane (CH4), and nitrous oxide (N2O) into the atmosphere. These gases contribute to global warming and climate change by trapping heat and altering the Earth’s energy balance. Farming is both a source and a sink of greenhouse gases, meaning that it can either emit or absorb them depending on the practices and management of the land.

According to the Intergovernmental Panel on Climate Change (IPCC), agriculture accounted for about 10.6% of global anthropogenic greenhouse gas emissions in 2010. However, this estimate does not include emissions from land use change and forestry, which are often associated with agricultural expansion and intensification. If these emissions are included, the share of agriculture in global greenhouse gas emissions could be as high as 24%^2^.

The main sources of greenhouse gas emissions from farming are:

– Enteric fermentation: This is the process by which ruminant animals, such as cattle, sheep, and goats, digest plant material in their stomachs and produce methane as a by-product. Methane is a potent greenhouse gas, with a global warming potential (GWP) of 28 times that of CO2 over a 100-year period. Enteric fermentation is the largest source of methane emissions from agriculture, accounting for about 40% of total agricultural emissions in 2010.
– Manure management: This is the handling and storage of animal waste, which can also produce methane and nitrous oxide emissions. Methane is generated when manure decomposes anaerobically (without oxygen), such as in liquid or slurry systems. Nitrous oxide is emitted when manure is applied to soils or stored in aerobic (with oxygen) conditions, such as in solid or dry systems. Manure management contributed about 16% of total agricultural emissions in 2010.
– Synthetic fertilizers: These are chemical substances that provide nutrients, such as nitrogen and phosphorus, to crops and enhance their growth and yield. However, when applied in excess or under inappropriate conditions, synthetic fertilizers can also cause nitrous oxide emissions from soils. Nitrous oxide is a powerful greenhouse gas, with a GWP of 265 times that of CO2 over a 100-year period. Synthetic fertilizers were responsible for about 13% of total agricultural emissions in 2010.
– Rice cultivation: This is the production of rice, which is a staple food for more than half of the world’s population. Rice cultivation involves flooding the fields with water, creating anaerobic conditions that favor methane production

Greenhouse Gas Emissions From Farming

Middle East & North Africa Births per woman

The above graph shows Middle East & North Africa Births per woman. This is according to World Bank birth stats by country. Based on the latest available information for Middle East & North Africa.

Fertility rates across the Middle East and North Africa vary but tend to be higher than global averages, particularly in lower-income and rural areas. Urbanization, education, and healthcare improvements are leading to gradual fertility declines, but population growth remains significant in many countries.

Middle East & North Africa Births per woman

Sri Lanka Births per woman

Chart above demonstrates Sri Lanka Births per woman. World Bank is the source of this birth data. Latest births per woman information for Sri Lanka.

Sri Lanka has experienced declining fertility rates due to improvements in education, healthcare, and economic development. Birth rates are now near replacement level, reflecting demographic transition typical of middle-income countries with aging populations emerging.

Sri Lanka Births per woman

Euro area Births per woman

Chart above demonstrates Euro area Births per woman. World Bank is the source of this birth data. Based on the latest available information for Euro area.

The Euro area experiences low fertility rates well below replacement level, reflecting aging populations and socioeconomic factors. Family policies vary by country, but overall trends indicate continuing demographic challenges related to population decline and workforce sustainability.

Euro area Births per woman

Nicaragua Births per woman

The above graph shows Nicaragua Births per woman. This is according to World Bank birth stats by country. Latest births per woman information for Nicaragua.

Nicaragua’s fertility rate has been declining due to increased education and healthcare access, though it remains moderately high. Rural areas maintain higher birth rates compared to urban centers. Population growth continues but at a slower pace, with migration and economic factors influencing demographic trends.

Nicaragua Births per woman

Lithuania Population

This diagram presents Lithuania Population. The country statistics are compiled by World Bank. Based on the latest available information for Lithuania.

Lithuania’s population has been shrinking due to low birth rates and emigration, especially among young adults seeking opportunities in Western Europe. The country faces a rapidly aging population, prompting initiatives to attract returnees and support family growth.

Lithuania Population

Real Number Set Diagram

The set of real numbers is the most commonly used number system in mathematics and science. It includes all the numbers that can be represented by a decimal expansion, such as 3.14, -5, 0.333…, or ?2. The set of real numbers can be divided into two subsets: the rational numbers and the irrational numbers. The rational numbers are those that can be written as a ratio of two integers, such as 2/3, -4/5, or 7. The irrational numbers are those that cannot be written as a ratio of two integers, such as ?, e, or ?3. The irrational numbers have non-terminating and non-repeating decimal expansions.

The set of real numbers can be visualized by a number line, which is a horizontal line with a point labeled 0 at the center and equally spaced points to the left and right of 0. Each point on the number line corresponds to a real number, and the distance between any two points is the absolute value of their difference. For example, the distance between 2 and -3 on the number line is |2 – (-3)| = |2 + 3| = |5| = 5. The absolute value of a real number is always non-negative, and it measures how far the number is from 0. For example, the absolute value of -4 is |-4| = 4, which means that -4 is 4 units away from 0 on the number line.

The set of real numbers has many important properties and operations, such as addition, subtraction, multiplication, division, exponentiation, and order. These properties and operations obey certain rules, such as the commutative, associative, and distributive laws, which allow us to manipulate and simplify expressions involving real numbers. The set of real numbers also has special elements, such as 0, 1, and -1, which have unique roles in the operations. For example, 0 is the additive identity, which means that adding 0 to any real number does not change its value. Similarly, 1 is the multiplicative identity, which means that multiplying any real number by 1 does not change its value. And -1 is the additive inverse of 1, which means that adding -1 to 1 gives 0.

The set of real numbers is the foundation of many branches of mathematics, such as algebra, geometry, calculus, and analysis. It is also widely used in modeling and solving real-world problems, such as physics, engineering, economics, and statistics. The set of real numbers is not the only

Real Number Set Diagram 98