Who Owns Facebook. Chart, listing shareholders. January 2011. Source: http://www.disinfo.com/tag/goldman-sachs/ https://ygraph.com/chart/476
Who Owns Facebook. Chart, listing share

Charts, Graphs and Diagrams
Who Owns Facebook. Chart, listing shareholders. January 2011. Source: http://www.disinfo.com/tag/goldman-sachs/ https://ygraph.com/chart/476

Silver Price 2003-2011. Source: http://etfdailynews.com/2011/03/16/gold-silver-and-mining-stocks-decline-as-stocks-lead-the-way-gld-iau-sgol-gdx-gdxj-sivr-slv-dbs-agq-zsl/ https://ygraph.com/chart/474

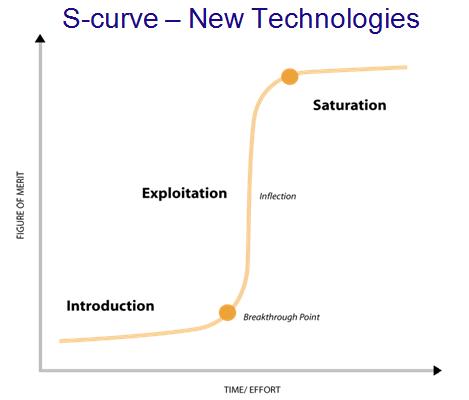
Business S-curve, New Technologies. Source: The Technology Adoptation Cycle. Innovators, Early Adopters, Early Majority, Late Majority, Laggards. Technology Adoption curve showing different stages of technology development, maturity and use. business s-curve

Landscape of the Technology Adoption Life-Cycle: The Chasm, The tornado, The bowling valley, Main Street, End of Life. Source: http://freelancerconsulting.com/business-frameworks/technology-adoption-product-life-cycle.html https://ygraph.com/chart/440

The Technology Adoption Cycle. Innovators, Early Adopters, Early Majority, Late Majority, Laggards. Source: http://freelancerconsulting.com/business-frameworks/technology-adoption-product-life-cycle.html https://ygraph.com/chart/441

Bases of Competitive Advantage. Source: http://freelancerconsulting.com/business-frameworks/positioning-strategy-scope-cost-differentiation-focus.html https://ygraph.com/chart/437

Bussiness Level Strategy: Product Differentiation, Cost Leadership, Focus Differentiation, Cost Differentiation, Cost Focus. Source: http://freelancerconsulting.com/business-frameworks/positioning-strategy-scope-cost-differentiation-focus.html https://ygraph.com/chart/433

Porter’s Value Chain Analysis: Internal analysis. Porter Value Chain Chart. Porter’s Framework. Porter’s Diagram. Porter’s Strategy Value chain analysis. Internal analysis. Business analysis. Source: Porter’s Value Chain Analysis – Porter’s Value Chain

Logarithmic PH Scale – PH Scale – Logarithmic Scale PH – PH Scale Color – Logarithmic Scale. Relationship between H+, OH- and PH. Relationship between acid and basis. Basicity and acidity index. PH index. H comparison. Logarithmic acidity scale. Concentration mol per liter. Source: All about PH logarithmic ph scale

Volcano Diagram – Volcano Chart – Volcano Eruption Diagram – Volcanos Diagram – Diagram of Magna – Volcano Explained Diagram – Volcano Image. Source: Planet Earth volcano diagram
