Power Production in the USA. Coal / Natural Gas, Nuclear, Hydroelectric share. Source http://www.econgrapher.com/top5graphs22may11.html https://ygraph.com/chart/494
Power Production in the USA. Coal / Natu

Charts, Graphs and Diagrams
Power Production in the USA. Coal / Natural Gas, Nuclear, Hydroelectric share. Source http://www.econgrapher.com/top5graphs22may11.html https://ygraph.com/chart/494

Commodity Index 1994-2010. On a rolling 12 month return basis. Source: http://www.econgrapher.com/top5graphs22may11.html https://ygraph.com/chart/493

European Inflation 2000-2011. EU Inflation Graph. Source: http://www.econgrapher.com/top5graphs22may11.html https://ygraph.com/chart/491

US Mutual Fund Flows. 2007-2011. Source: http://www.econgrapher.com/ https://ygraph.com/chart/490

US Consumer Sentiment. 2006-2011. Source: http://www.econgrapher.com/ https://ygraph.com/chart/489

Japanese International trade. 2006-2011 Source: http://www.econgrapher.com/ https://ygraph.com/chart/488

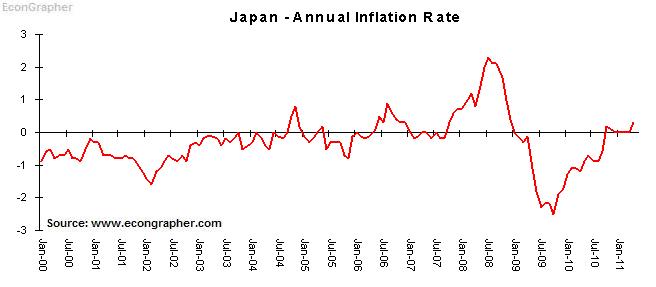
Japan Annual Inflation Rate 2000-2011. Source: http://www.econgrapher.com/ https://ygraph.com/chart/487

United States GDP Growth. 2001-2010. Source: http://www.econgrapher.com/top5graphs26mar11.html https://ygraph.com/chart/483

New USA Economic Forecast Through 2011: Stagnanation. Source: http://www.bullfax.com/?q=node-new-economic-forecast-through-2011-stagnant-word-0 https://ygraph.com/chart/481

Biggest Risks in 2011. European Sovereign Debt Crisis. Turmoil in the Arab World, rising oil prices. China tightening rates. Japanese Recession. Source: http://www.collegestockpro.com/201104062580/college-stock-pro/biggest-market-risk-middle-east-turmoil/ https://ygraph.com/chart/479
