Liter Conversion Chart: A liter conversion chart is used to translate liters into other volume units such as milliliters (mL), cubic centimeters (cc), gallons, quarts, pints, and fluid ounces across metric and imperial systems. For instance, 1 liter equals 1000 mL or approximately 0.264 gallons. These charts help in cooking, scientific experiments, and international trade, ensuring accurate volume measurements and eliminating confusion between different measurement systems.
Car Diagram
Car Diagram: A detailed car diagram labels both external and internal components, including engine, transmission, chassis, brake system, suspension, and electrical systems. On the exterior, parts such as the bumper, headlights, side mirrors, and tires are clearly marked. Internally, components like the steering wheel, dashboard, and gear system are labeled to help users understand basic vehicle mechanics. These diagrams are especially useful in educational settings, mechanical training, and vehicle manuals.
Consumer Brands
Consumer Brands: A diagram featuring consumer brands may categorize well-known companies by industrysuch as technology, food and beverage, fashion, automotive, and personal careand showcase their logos or parent companies. Brands like Apple, Nike, Coca-Cola, and Procter & Gamble often appear, sometimes linked in brand trees to their parent corporations. These visual representations help users understand market dominance, brand relationships, and consumer choice, illustrating how a few large conglomerates may own dozens of familiar everyday labels.
Bra sizes chart
Bra sizes chart: A bra size chart combines band size (measured around the ribcage) and cup size (which reflects the difference between the bust and band measurements) to determine an individuals correct fit. For example, a 34B means a 34-inch band with a B cup size. These charts often display sizes in a matrix or grid format, with international conversionslike UK, EU, US, and Japanese sizingand may include tips for determining a sister size, which helps adjust fit when one measurement changes but the other does not. A well-labeled chart is essential for proper support, comfort, and breast health.
Animals Chart
Animals Chart – Wild Animals Chart. Wild animals chart: elephant, tiger, lion, zebra, kangaroo, deer, giraffe, gorilla, panther, monkey, panda, fox, bear, polar bear, rhinoceros, hippo, hippopotamus chart. Wild animals chart for kids, educational. Source: Pandorabox https://ygraph.com/chart/1392
Pollination Diagram
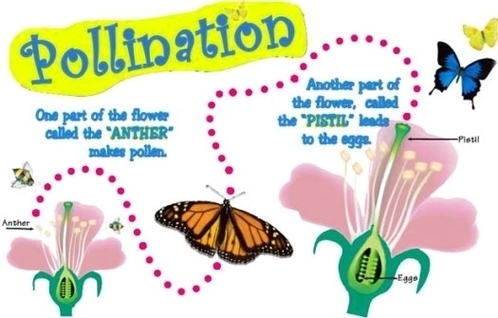
Process of Pollination The process of pollination begins when the pollen grains from the respective flowers lands on the stigma and form a pollen tube with the style length, which connects both the stigma and ovary. After the completion of the pollen tube, the pollen grain starts transmitting sperm cells from the grain to the ovary.
All plants having flowers completely rely on pollination method for reproduction. There are 2 types of pollination – It is referred to as the primary type of pollination as it includes a single flower. Self-pollination occurs when pollen grains fall directly from anther into the stigma of the flower.
It is of two types, self-pollination and cross pollination. Type # 1. Self-Pollination: It is the transfer of pollen grains from the anther to the stigma of same flower or to the different flower on the same plant. a. Autogamy:
Photosynthesis diagram
This article will introduce the process of photosynthesis, how it works, and how to draw a flowchart to represent the workflow inside the plant when photosynthesis happens. Photosynthesis is the process that happens in every autotrophic organisms like green plants, they use light energy from the sun to make sugar and oxygen gas from CO and water.
The Process of Photosynthesis in Plants! Life on earth ultimately depends on energy derived from sun. Photosynthesis is the only process of biological importance that can harvest this energy. Literally photosynthesis means ‘synthesis using light’.
Photosynthesis Diagram According to the diagram of photosynthesis, the process begins with three most important non-living elements: water, soil, and carbon dioxide. Plants begin making their ‘food’, which basically includes large quantities of sugars and carbohydrate, when sunlight falls on their leaves.

The Water Cycle
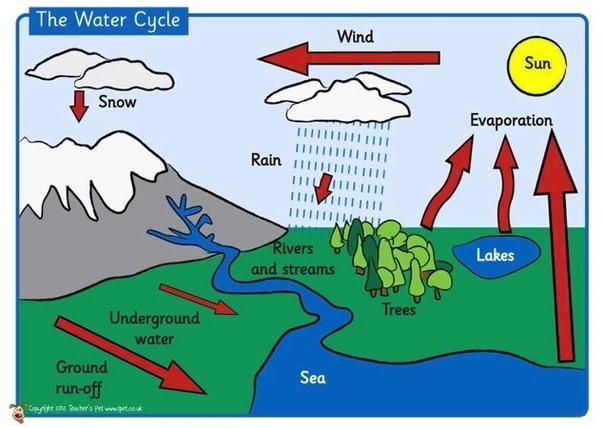
What is the Water Cycle? The water cycle, also known as the hydrologic cycle or the hydrological cycle, describes the continuous movement of water on, above and below the surface of the Earth. During this process, water changes its state from one phase to another, but the total number of water particles remains the same.
There are three states of water namely solid (ice), liquid, and vapour. The water cycle, which is also known as the hydrological cycle or the hydrologic cycle, refers to the endless movement of water below, on, or above the earth’s surface.
The water cycle is the path that all water follows as it moves around Earth in different states. Liquid water is found in oceans, rivers, lakes—and even underground. Solid ice is found in glaciers , snow, and at the North and South Poles .
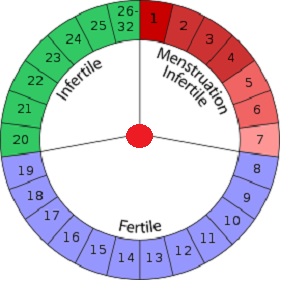
Menstrual Cycle – Ovulation Cycle
Menstrual Cycle – Period Chart – Fertility Cycle Diagram – Calendar Fertility Chart – Menstruation Chart – Menstruation Diagram – Women Period Chart
Ovulation Cycle – Menstruation Cycle Chart – Menstrual Cycle Chart – Ovulation Diagram. Ovulation Calendar. Menstrual Calendar. When is it safe to have sex? Which days of the menstrual cycle are safe for sex? Ovulation and fertility chart.
Ovulation Cycle
Menstrual Cycle – Period Chart – Fertility Cycle Diagram – Calendar Fertility Chart – Menstruation Chart – Menstruation Diagram – Women Period Chart. Monthly menstrual chart showing periods where women are infertile and fertile. Menstrual Circle.
Menstrual Cycle