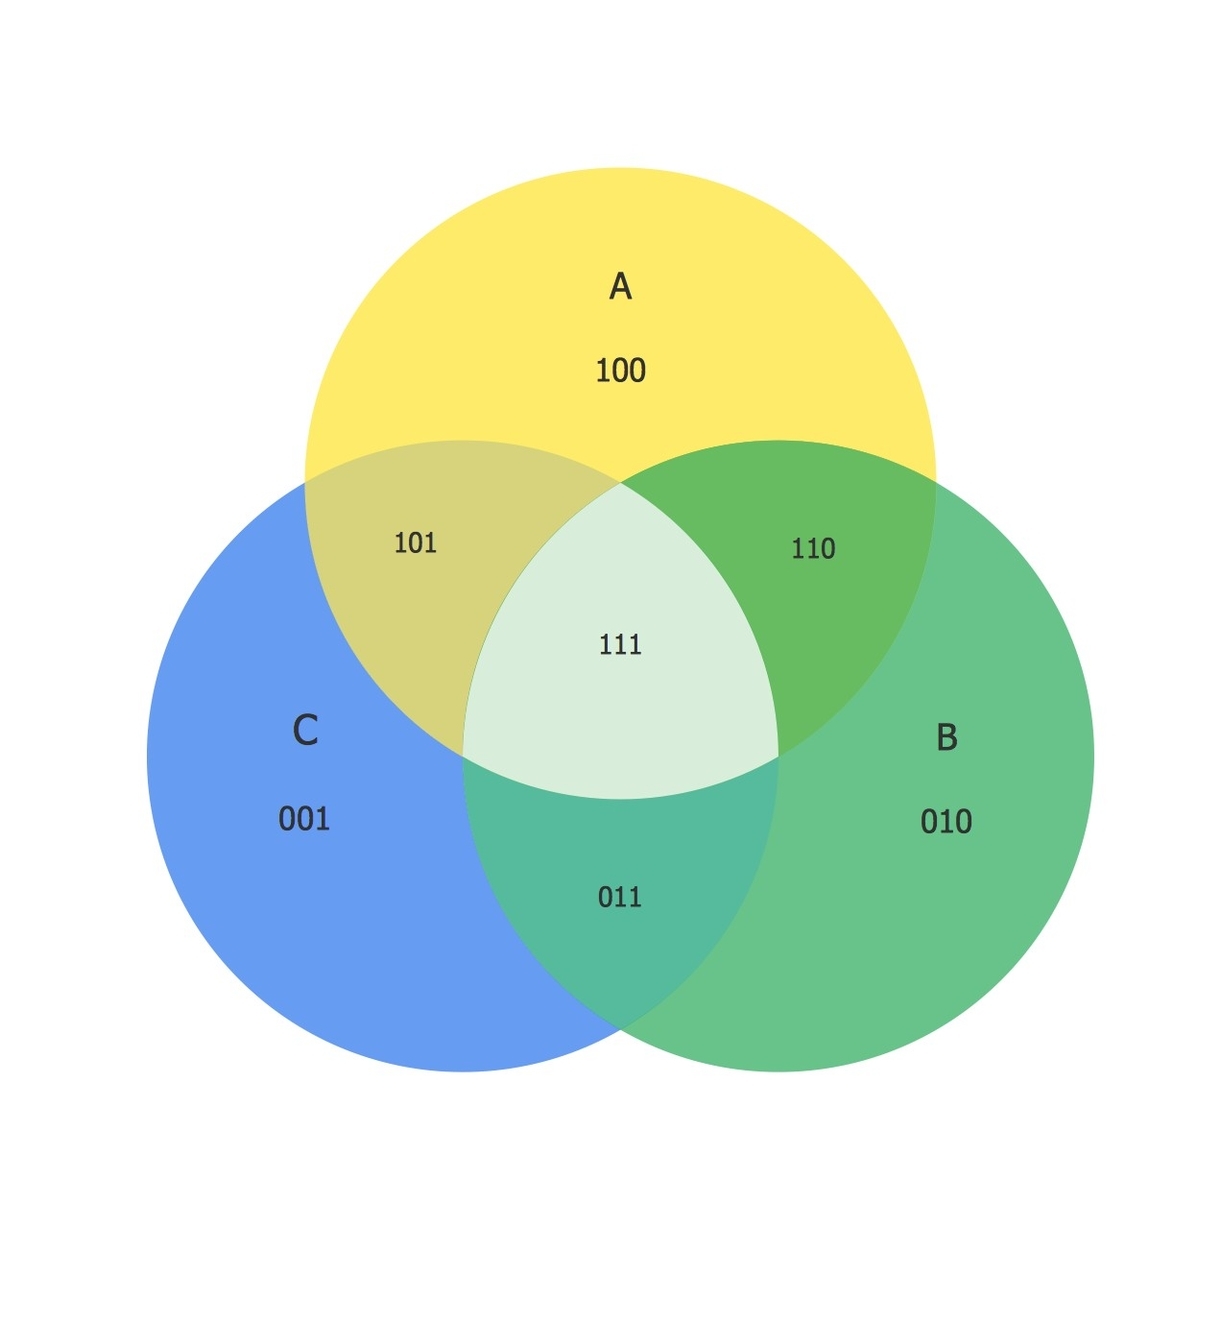
Venn diagrams are a graphical representation of the relationships between different sets of data. They are used to compare and contrast different categories. A three-circle Venn diagram is a type of Venn diagram that is used to compare and contrast three different categories. Each circle in the diagram represents a different category, and the overlapping regions between the circles represent properties that are shared between the categories.
Venn diagrams can be used to compare and contrast a wide range of different categories. They can be used to compare and contrast different types of food, different types of music, or different types of sports. They can also be used to compare and contrast different groups of people, such as different age groups or different genders.
When solving problems using Venn diagrams, it is important to follow a step-by-step approach. The first step is to understand the problem. The second step is to draw the diagram. The third step is to label the diagram. Each circle (set) should be labeled appropriately. The fourth step is to fill in the values. The fifth step is to solve the problem. The sixth and final step is to check your answer .
Venn diagrams can be used to solve a wide range of problems. For example, suppose that in a town, 800 people are selected by random types of sampling methods. 280 go to work by car only, 220 go to work by bicycle only and 140 use both ways sometimes go with a car and sometimes with a bicycle. Here are some important questions we will find the answers: How many people go to work by car only? How many people go to work by bicycle only? How many people go by neither car nor bicycle? How many people use at least one of both transportation types? How many people use only one of car or bicycle? The following Venn diagram represents the data above:

Number of people who go to work by car only = 280. Number of people who go to work by bicycle only = 220. Number of people who go by neither car nor bicycle = 160. Number of people who use at least one of both transportation types = n (only car) + n (only bicycle) + n (both car and bicycle) = 280 + 220 + 140 = 640 .
In conclusion, Venn diagrams are a useful tool for comparing and contrasting different categories. They can be used to solve a wide range of problems, such as those involving transportation methods. When solving problems using Venn diagrams, it is important to follow a step-by-step approach, which includes understanding the problem, drawing the diagram, labeling the diagram, filling in the values, solving the problem, and checking your answer. .